Performance measurement and profiling
Profiling Basics
Before you profile, you must have a stable environment to get repeatable results.
- The machine must be idle - don't profile on shared hardware, don't browse the web while waiting for a long benchmark to run.
- Watch out for power saving and thermal scaling.
- Avoid virtual machines and shared cloud hosting; they are too noisy for consistent measurements.
- There is a kernel bug on OS X versions less than El Capitan; upgrade or avoid profiling on OS X.
CPU profiling
CPU profiling is the most common type of profile. When CPU profiling is enabled, the runtime will interrupt itself every 10ms and record the stack trace of the currently running coroutines. Once the profile is saved to disk, we can analyze it to determine the hottest code paths. The more times a function appears in the profile, the more time that code path is taking as a percentage of the total runtime.
Memory profiling
Memory profiling records the stack trace when a heap allocation is made like CPU profiling is sample based. By default memory profiling samples 1 in every 1000 allocations. This rate can be changed. Stack allocations are assumed to be free and are not tracked in the memory profile.
Because of memory profiling is sample based and because it tracks allocations not use, using memory profiling to determine your application's overall memory usage is difficult.
Using Dave Cheney's excellent profile library pprof.
$ go tool pprof /path/to/your/binary /path/to/your/profile
The binary argument must be the binary that produced this profile.
The profile argument must be the profile generated by this binary.
For example, create fibonacci folder and put following files into it, fibonacci.go:
package fibonacci

// fibonacci is a function that returns a function that returns an int.
func fibonacci() func() int {
    a, b := 0, 1
    return func() int {
        a, b = b, a+b
        return a
    }
}

func loop(j int) {
    f := fibonacci()
    for i := 0; i < j; i++ {
        println(f())
    }
}
fibonacci_test.go:
package fibonacci

import (
    "testing"
)

func Test_fibonacci(t *testing.T) {
    loop(10)
}

func Benchmark_fibonacci(b *testing.B) {
    // use b.N for looping
    for i := 0; i < b.N; i++ {
        loop(10)
    }
}
In Use
$ go test -v -run=^$ -bench=. -benchtime=3s -cpuprofile=prof.cpu -memprofile=prof.mem -memprofilerate=2
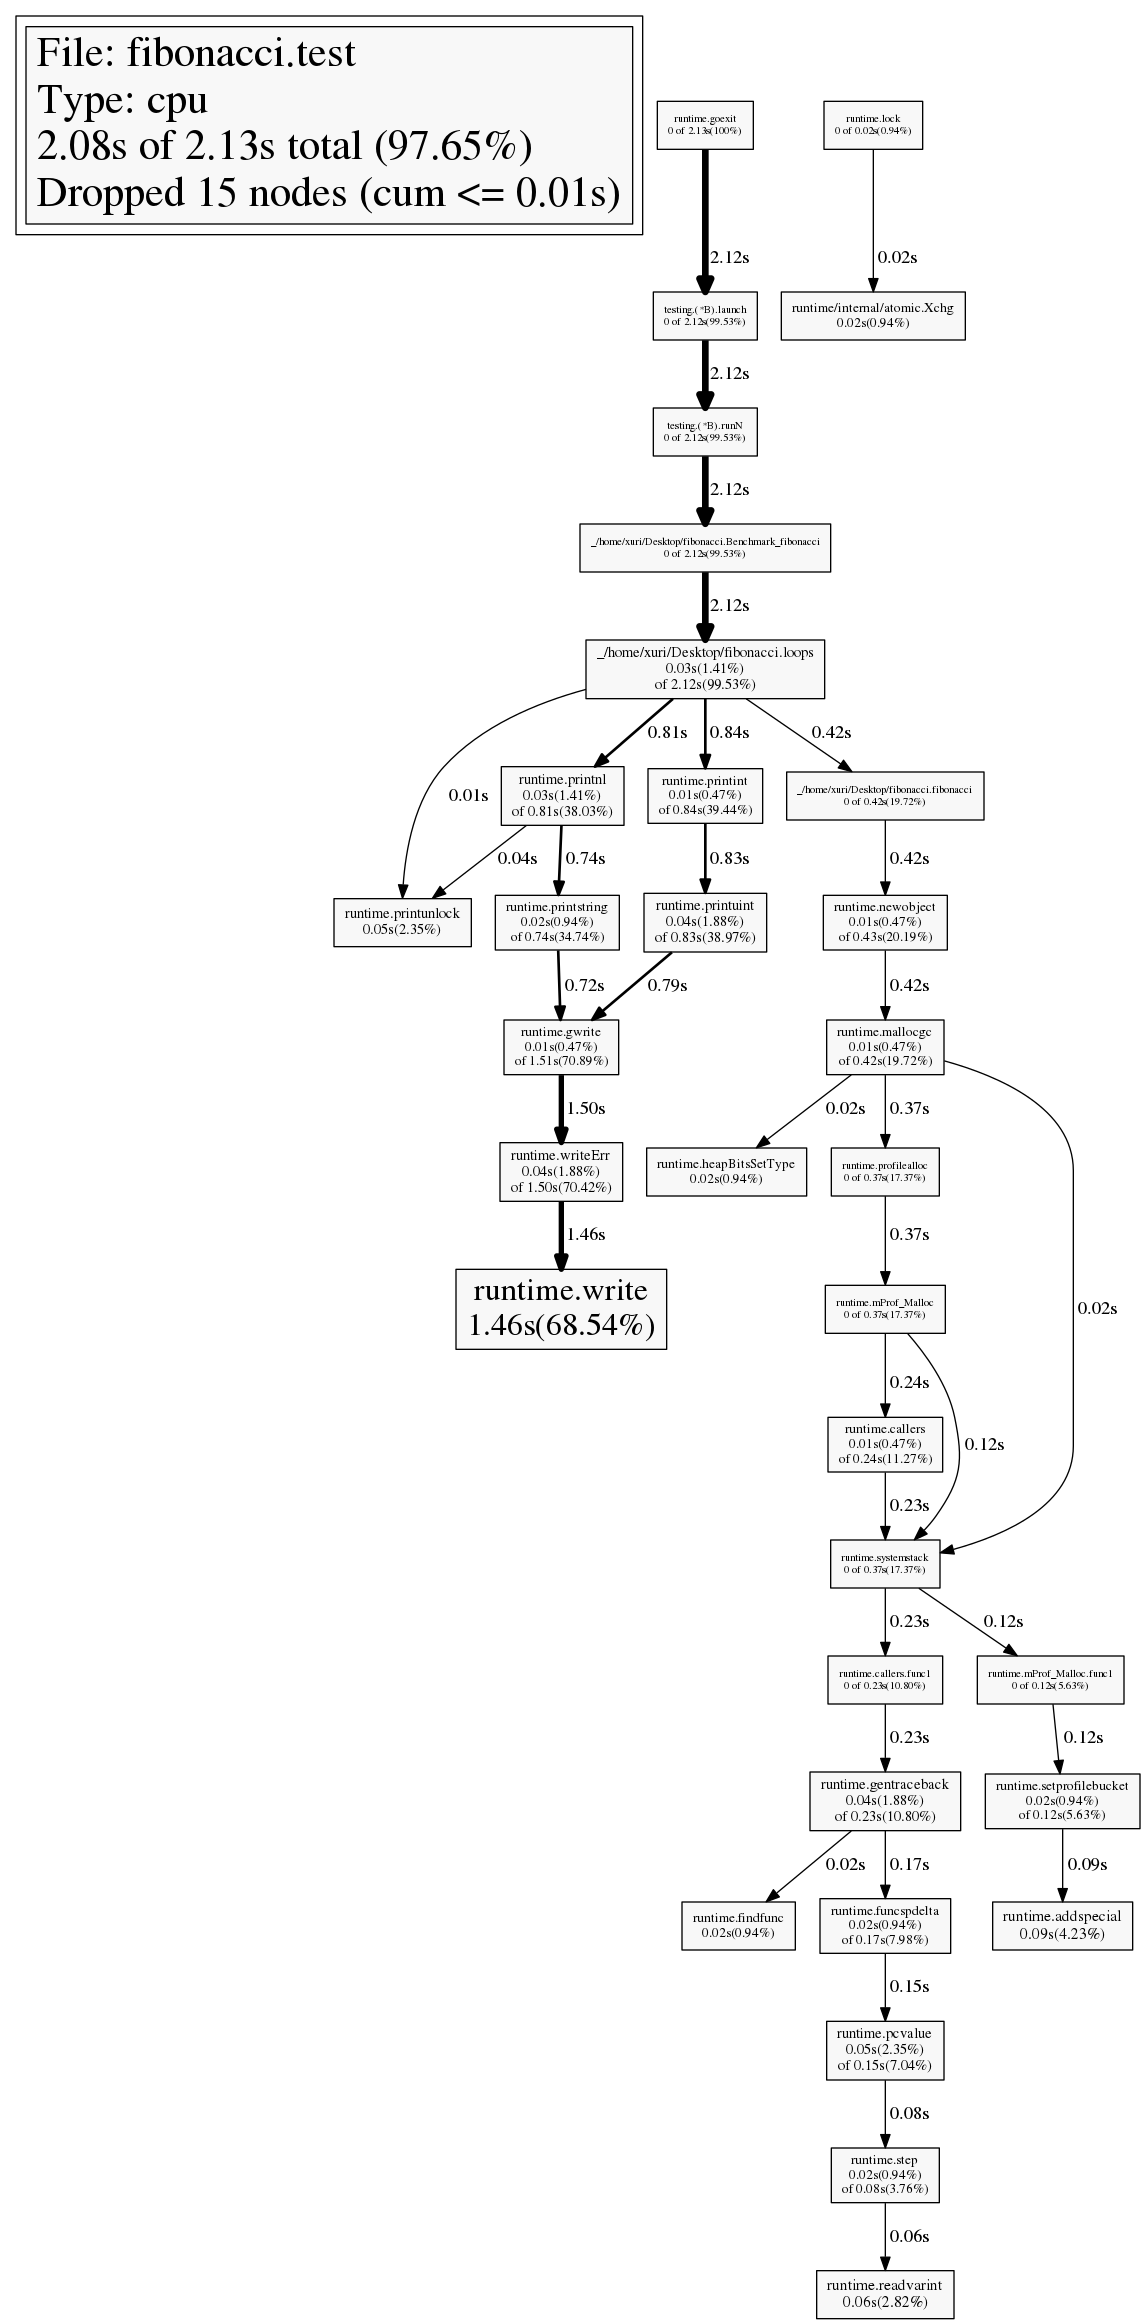
CPU Profiling
$ go tool pprof fibonacci.test prof.cpu

Entering interactive mode (type "help" for commands)
(pprof) top
2.18s of 2.22s total (98.20%)
Dropped 6 nodes (cum <= 0.01s)
Showing top 10 nodes out of 19 (cum >= 0.02s)
      flat  flat%   sum%        cum   cum%
     1.93s 86.94% 86.94%      1.93s 86.94%  runtime.write
     0.05s  2.25% 89.19%         2s 90.09%  runtime.gwrite
     0.04s  1.80% 90.99%      2.21s 99.55%  _/home/xuri/Desktop/fibonacci.loop
     0.04s  1.80% 92.79%      0.07s  3.15%  runtime.printunlock
     0.04s  1.80% 94.59%      0.04s  1.80%  runtime/internal/atomic.Xchg
     0.02s   0.9% 95.50%      0.02s   0.9%  runtime.mallocgc
     0.02s   0.9% 96.40%      0.98s 44.14%  runtime.printuint
     0.02s   0.9% 97.30%      1.95s 87.84%  runtime.writeErr
     0.01s  0.45% 97.75%      0.99s 44.59%  runtime.printint
     0.01s  0.45% 98.20%      0.02s   0.9%  runtime.printlock

(pprof) top --cum
2.06s of 2.22s total (92.79%)
Dropped 6 nodes (cum <= 0.01s)
Showing top 10 nodes out of 19 (cum >= 1.05s)
      flat  flat%   sum%        cum   cum%
         0     0%     0%      2.21s 99.55%  _/home/xuri/Desktop/fibonacci.Benchmark_fibonacci
     0.04s  1.80%  1.80%      2.21s 99.55%  _/home/xuri/Desktop/fibonacci.loop
         0     0%  1.80%      2.21s 99.55%  runtime.goexit
         0     0%  1.80%      2.21s 99.55%  testing.(*B).launch
         0     0%  1.80%      2.21s 99.55%  testing.(*B).runN
     0.05s  2.25%  4.05%         2s 90.09%  runtime.gwrite
     0.02s   0.9%  4.95%      1.95s 87.84%  runtime.writeErr
     1.93s 86.94% 91.89%      1.93s 86.94%  runtime.write
     0.01s  0.45% 92.34%      1.09s 49.10%  runtime.printnl
     0.01s  0.45% 92.79%      1.05s 47.30%  runtime.printstring

(pprof) list loop
Total: 2.22s
ROUTINE ======================== _/home/xuri/Desktop/fibonacci.loop in /home/xuri/Desktop/fibonacci/fibonacci.go
      40ms      2.21s (flat, cum) 99.55% of Total
         .          .      9:       return a
         .          .     10:   }
         .          .     11:}
         .          .     12:
         .          .     13:func loop(j int) {
         .       20ms     14:   f := fibonacci()
         .          .     15:   for i := 0; i < j; i++ {
      40ms      2.19s     16:       println(f())
         .          .     17:   }
         .          .     18:}

(pprof) web
The web command writes a graph of the profile data in the SVG format and opens it in a web browser. (There is also a gv command that writes PostScript and opens it in Ghostview. For either command, you need graphviz installed.)
Save the callgraph as a PNG file:
$ go tool pprof -png fibonacci.test prof.cpu > prof.cpu.png
Getting a heap profile from URL
$ go tool pprof -png http://localhost:6060/debug/pprof/heap > out.png
Visual sampling file `pb.gz` file
$ go tool pprof -web /path/to/profile.pb.gz
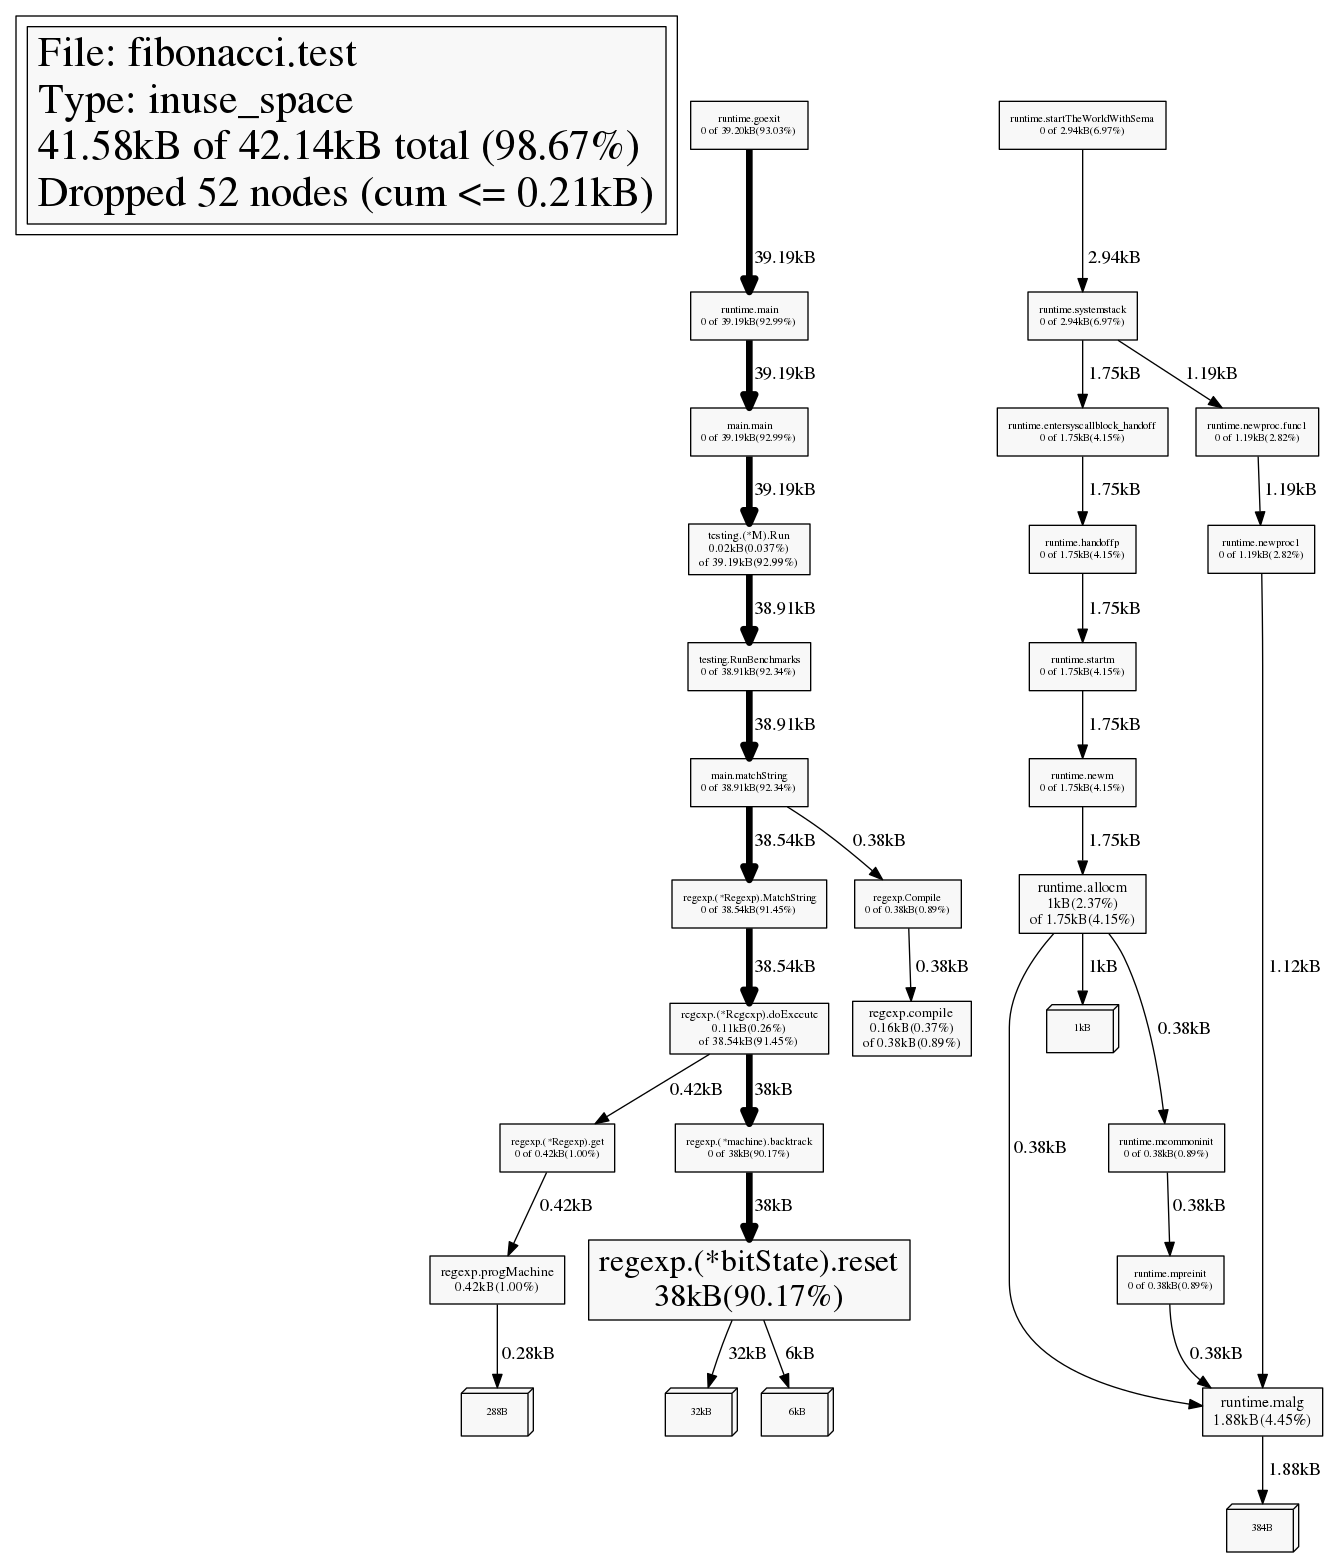
Memory Profiling
-inuse_space      Display in-use memory size
-inuse_objects    Display in-use object counts
-alloc_space      Display allocated memory size
-alloc_objects    Display allocated object counts
$ go tool pprof -alloc_space fibonacci.test prof.mem

Entering interactive mode (type "help" for commands)
(pprof) top
5200.11kB of 5207.71kB total (99.85%)
Dropped 63 nodes (cum <= 26.04kB)
Showing top 10 nodes out of 15 (cum >= 39kB)
      flat  flat%   sum%        cum   cum%
 5161.56kB 99.11% 99.11%  5161.56kB 99.11%  _/home/xuri/Desktop/fibonacci.fibonacci
      38kB  0.73% 99.84%       38kB  0.73%  regexp.(*bitState).reset
    0.42kB 0.0081% 99.85%    40.21kB  0.77%  testing.RunBenchmarks
    0.11kB 0.0021% 99.85%       39kB  0.75%  regexp.(*Regexp).doExecute
    0.02kB 0.0003% 99.85%    43.18kB  0.83%  testing.(*M).Run
         0     0% 99.85%  5161.56kB 99.11%  _/home/xuri/Desktop/fibonacci.Benchmark_fibonacci
         0     0% 99.85%  5161.56kB 99.11%  _/home/xuri/Desktop/fibonacci.loops
         0     0% 99.85%    43.18kB  0.83%  main.main
         0     0% 99.85%    41.44kB   0.8%  main.matchString
         0     0% 99.85%       39kB  0.75%  regexp.(*Regexp).MatchString
(pprof) top --cum
5161.58kB of 5207.71kB total (99.11%)
Dropped 63 nodes (cum <= 26.04kB)
Showing top 10 nodes out of 15 (cum >= 41.44kB)
      flat  flat%   sum%        cum   cum%
         0     0%     0%  5204.77kB 99.94%  runtime.goexit
         0     0%     0%  5161.56kB 99.11%  _/home/xuri/Desktop/fibonacci.Benchmark_fibonacci
 5161.56kB 99.11% 99.11%  5161.56kB 99.11%  _/home/xuri/Desktop/fibonacci.fibonacci
         0     0% 99.11%  5161.56kB 99.11%  _/home/xuri/Desktop/fibonacci.loops
         0     0% 99.11%  5161.56kB 99.11%  testing.(*B).launch
         0     0% 99.11%  5161.56kB 99.11%  testing.(*B).runN
         0     0% 99.11%    43.18kB  0.83%  main.main
         0     0% 99.11%    43.18kB  0.83%  runtime.main
    0.02kB 0.0003% 99.11%    43.18kB  0.83%  testing.(*M).Run
         0     0% 99.11%    41.44kB   0.8%  main.matchString

(pprof) list loop
Total: 5.09MB
ROUTINE ======================== _/home/xuri/Desktop/fibonacci.loops in /home/xuri/Desktop/fibonacci/fibonacci.go
         0     5.04MB (flat, cum) 99.11% of Total
         .          .      9:       return a
         .          .     10:   }
         .          .     11:}
         .          .     12:
         .          .     13:func loops(j int) {
         .     5.04MB     14:   f := fibonacci()
         .          .     15:   for i := 0; i < j; i++ {
         .          .     16:       println(f())
         .          .     17:   }
         .          .     18:}

(pprof) disasm loop
Total: 5.09MB
ROUTINE ======================== _/home/xuri/Desktop/fibonacci.loops
         0     5.04MB (flat, cum) 99.11% of Total
         .          .     47dc20: FS MOVQ FS:0xfffffff8, CX
         .          .     47dc29: CMPQ 0x10(CX), SP
         .          .     47dc2d: JBE 0x47dc9e
         .          .     47dc2f: SUBQ $0x20, SP
         .     5.04MB     47dc33: CALL _/home/xuri/Desktop/fibonacci.fibonacci(SB)
         .          .     47dc38: MOVQ 0(SP), BX
         .          .     47dc3c: MOVQ BX, 0x18(SP)
         .          .     47dc41: XORL AX, AX
         .          .     47dc43: MOVQ AX, 0x8(SP)
         .          .     47dc48: MOVQ 0x28(SP), BP
         .          .     47dc4d: CMPQ BP, AX
         .          .     47dc50: JGE 0x47dc99
         .          .     47dc52: MOVQ 0x18(SP), DX
         .          .     47dc57: MOVQ 0(DX), BX
         .          .     47dc5a: CALL BX
         .          .     47dc5c: MOVQ 0(SP), BX
         .          .     47dc60: MOVQ BX, 0x10(SP)
         .          .     47dc65: CALL runtime.printlock(SB)
         .          .     47dc6a: MOVQ 0x10(SP), BX
         .          .     47dc6f: MOVQ BX, 0(SP)
         .          .     47dc73: CALL runtime.printint(SB)
         .          .     47dc78: CALL runtime.printnl(SB)
         .          .     47dc7d: CALL runtime.printunlock(SB)
         .          .     47dc82: MOVQ 0x8(SP), AX
         .          .     47dc87: INCQ AX
         .          .     47dc8a: MOVQ AX, 0x8(SP)
         .          .     47dc8f: MOVQ 0x28(SP), BP
         .          .     47dc94: CMPQ BP, AX
         .          .     47dc97: JL 0x47dc52
         .          .     47dc99: ADDQ $0x20, SP
         .          .     47dc9d: RET
         .          .     47dc9e: CALL runtime.morestack_noctxt(SB)
         .          .     47dca3: JMP _/home/xuri/Desktop/fibonacci.loops(SB)
         .          .     47dca8: INT $0x3
         .          .     47dca9: INT $0x3
         .          .     47dcaa: INT $0x3
         .          .     47dcab: INT $0x3
         .          .     47dcac: INT $0x3
         .          .     47dcad: INT $0x3
         .          .     47dcae: INT $0x3

(pprof) web
Save the callgraph as a PNG file:
$ go tool pprof -png fibonacci.test prof.mem > prof.mem.png
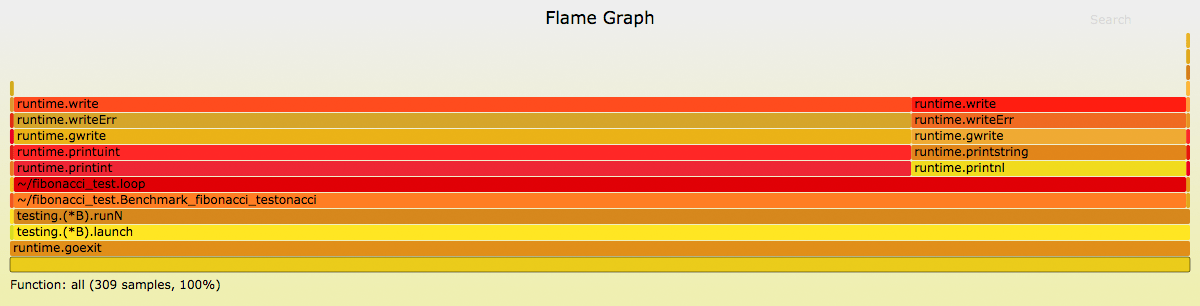
Stochastic flame graph profiler for Go programs
Install stack trace visualizer FlameGraph:
$ git clone https://github.com/brendangregg/FlameGraph.git
$ cp FlameGraph/flamegraph.pl /usr/local/bin
$ flamegraph.pl -help
USAGE: /usr/local/bin/flamegraph.pl [options] infile > outfile.svg

    --title       # change title text
    --width       # width of image (default 1200)
    --height      # height of each frame (default 16)
    --minwidth    # omit smaller functions (default 0.1 pixels)
    --fonttype    # font type (default "Verdana")
    --fontsize    # font size (default 12)
    --countname   # count type label (default "samples")
    --nametype    # name type label (default "Function:")
    --colors      # set color palette. choices are: hot (default), mem, io,
                  # wakeup, chain, java, js, perl, red, green, blue, aqua,
                  # yellow, purple, orange
    --hash        # colors are keyed by function name hash
    --cp          # use consistent palette (palette.map)
    --reverse     # generate stack-reversed flame graph
    --inverted    # icicle graph
    --negate      # switch differential hues (blue<->red)
    --help        # this message

    eg,
    /usr/local/bin/flamegraph.pl --title="Flame Graph: malloc()" trace.txt > graph.svg
Install stochastically profiling tool go-torch:
$ go get -v github.com/uber/go-torch
$ go-torch fibonacci.test prof.cpu
INFO[10:30:18] Run pprof command: go tool pprof -raw -seconds 30 fibonacci.test prof.cpu
INFO[10:30:19] Writing svg to torch.svg