Last Update: Feb 22, 2016
Introduction
Cacti is a complete network graphing solution designed to harness the power of RRDTool's data storage and graphing functionality. Cacti provides a fast poller, advanced graph templating, multiple data acquisition methods, and user management features out of the box. All of this is wrapped in an intuitive, easy to use interface that makes sense for LAN-sized installations up to complex networks with hundreds of devices.
Official Website www.cacti.net
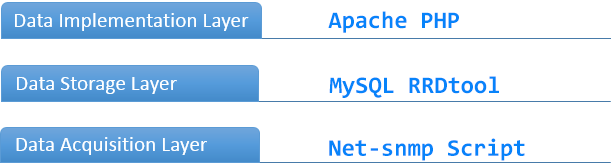
Cacti Architecture Diagram
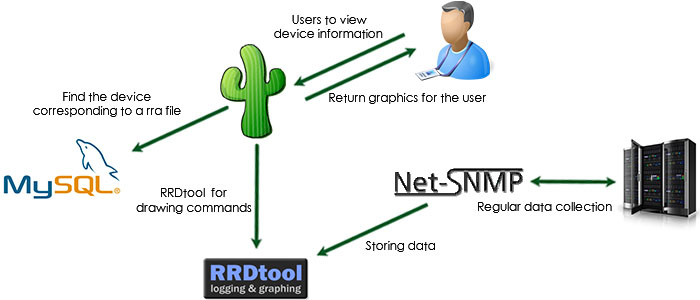
Cacti Working Principle
Installation
Cacti and all of its dependencies can by installed through apt-get on Ubuntu 12.04. This guide will also install cacti-spine, which is a faster way to poll servers for information than the default php script.
$ sudo apt-get update
$ sudo apt-get install cacti-spine
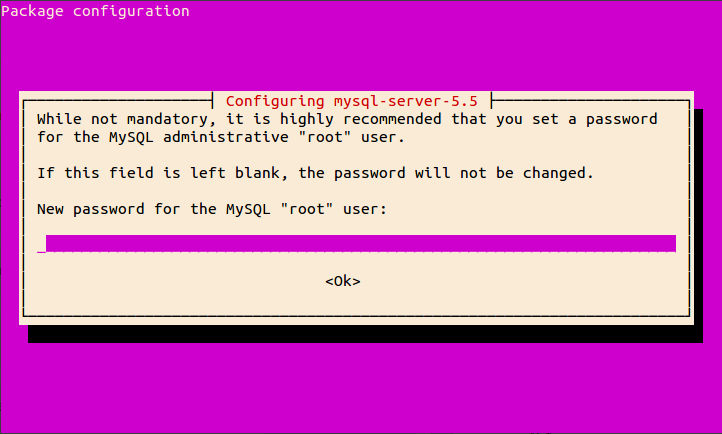
If you have not set up MySQL, you will be prompted for a root user password. Make your selection and confirm the password to continue.
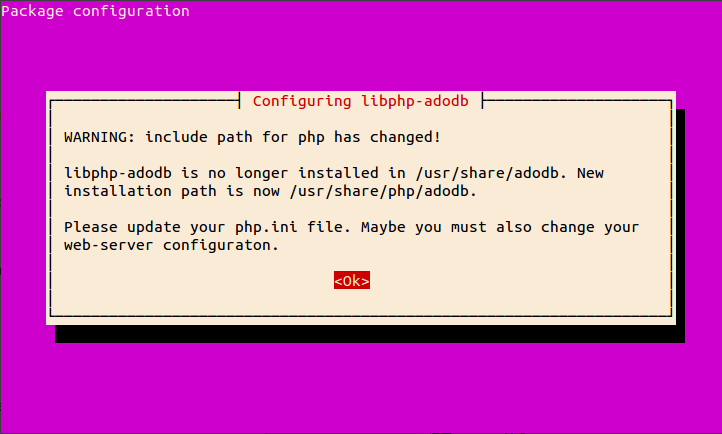
Next, press "Return" or "Enter" to acknowledge a configuration change in php.
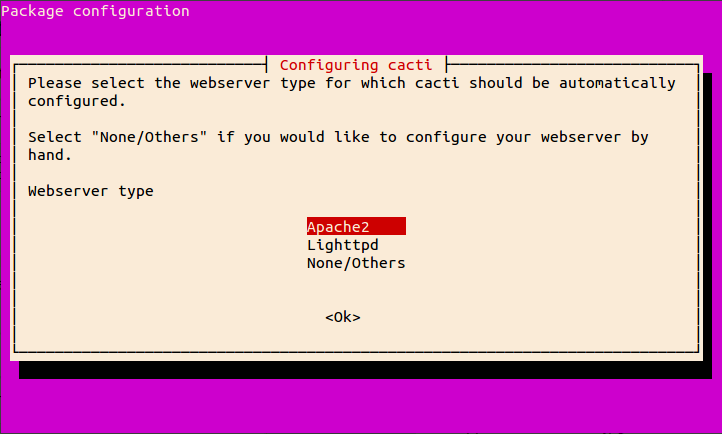
The initial configuration of Cacti also happens during installation. There are a few questions you need to answer. Select "Apache2" from the list of webservers.
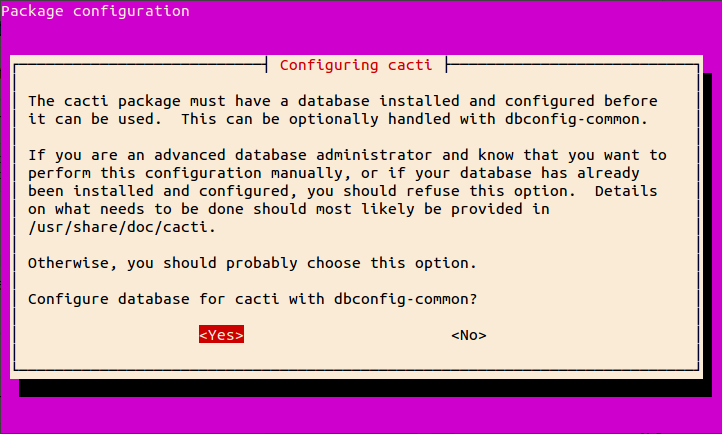
After Cacti configures apache, the installation sets up a MySQL account for the application. Select "Yes" to allow a generic database configuration.
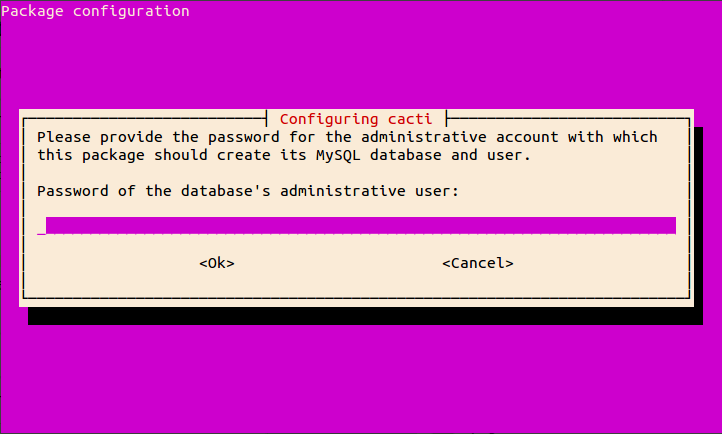
Provide the password for the administration of the Cacti database that you set up during the MySQL configuration.
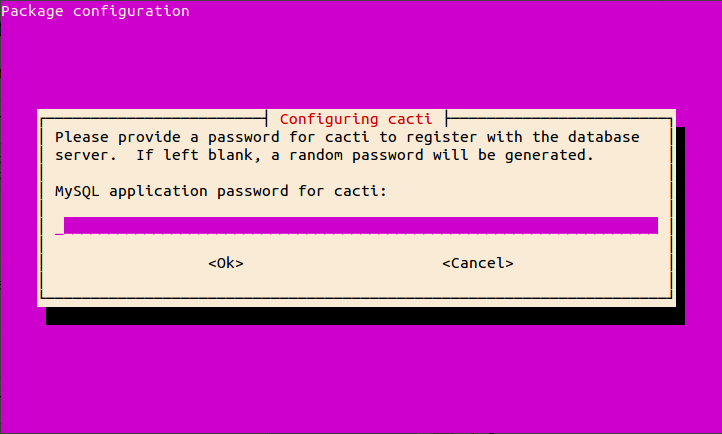
Next, it asks for a password for Cacti to use with the database. This is an internal password that you should not ever have to use, so it is okay if you just press "Enter" to create a random password.
Now that Cacti is installed, we can start the configuration process on it.
Configuration Cacti
One-Time Setup
Point your web browser towards http://YOURSERVERIP/cacti/install/ to start the initial setup and click next
The first page you will see is an introduction to the Cacti software. Click "Next >>" when you are finished reading. Click "Next >>" again on the following page since this is a new installation.
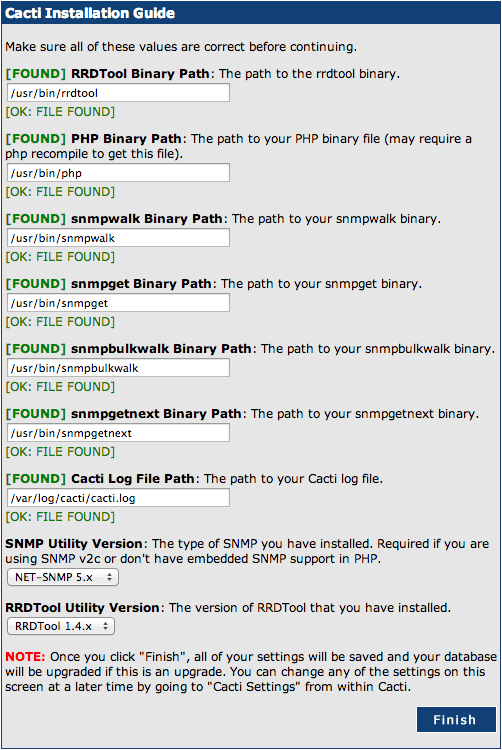
The next page shows the application paths of the "helper" applications that Cacti uses to operate. All of the applications should be green and marked with "[FOUND]". Click "Finish" to continue.
Next, you'll be asked to enter the Cacti user name and password. These are not the passwords you entered during installation. Instead, enter the following default values.
User Name: admin
Password: admin
You'll be prompted to enter a new password for administrating Cacti. Choose a password and click "Save".
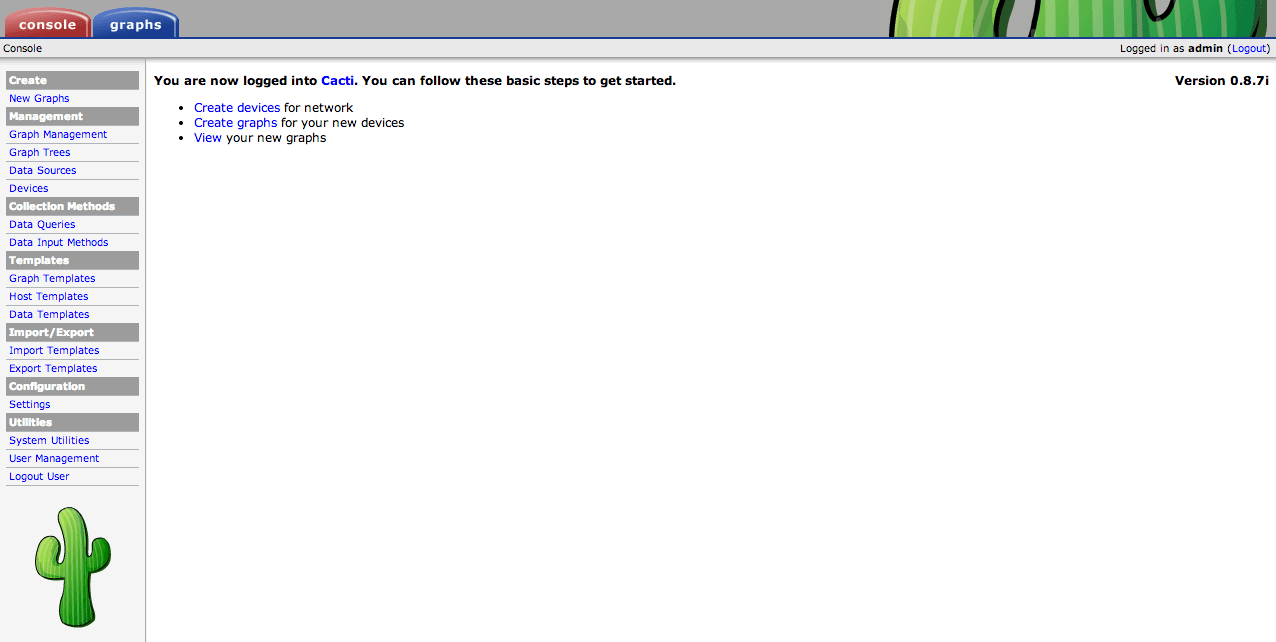
You are now on your Cacti page.
General Configuration
A few options must be changed to ensure that Cacti produces data correctly. On the left-hand navigation panel, click on "Settings" under the Configuration heading.
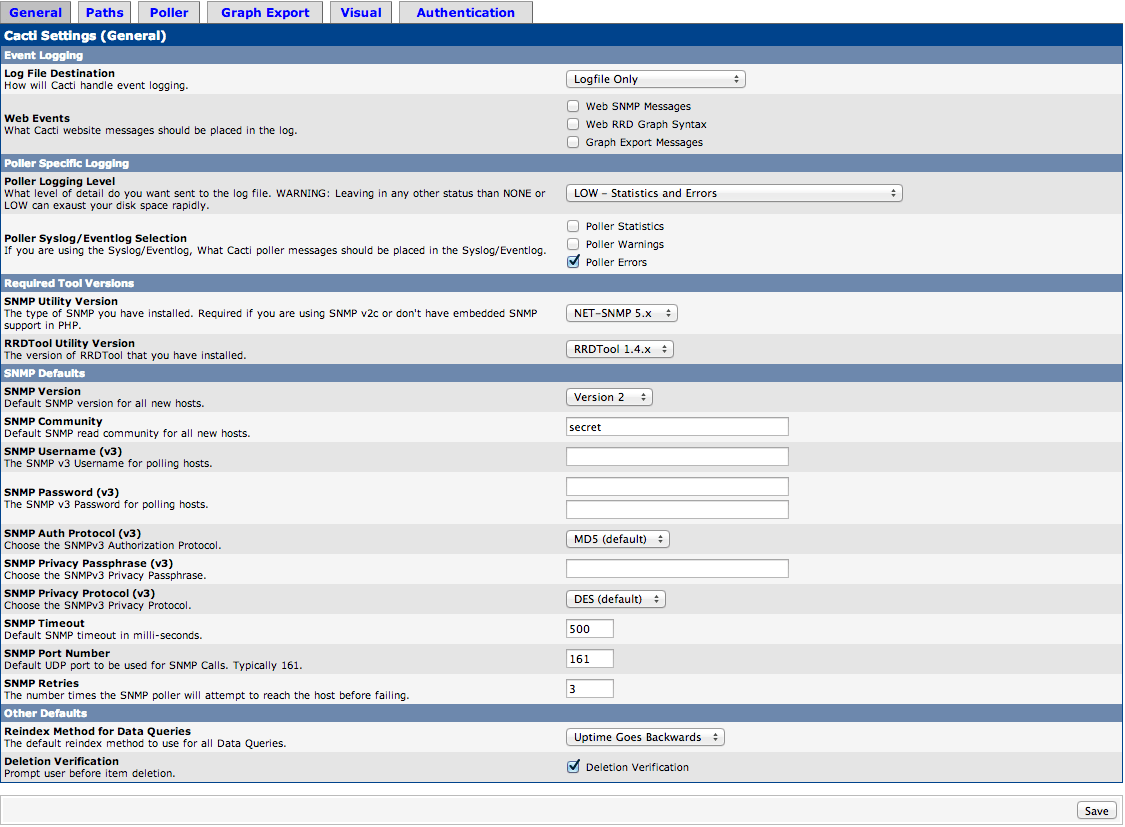
In the General tab, we want to change some parameters. Change these settings to match what is shown here. Click "Save" when finished.
SNMP Version: Version 2
SNMP Community: secret
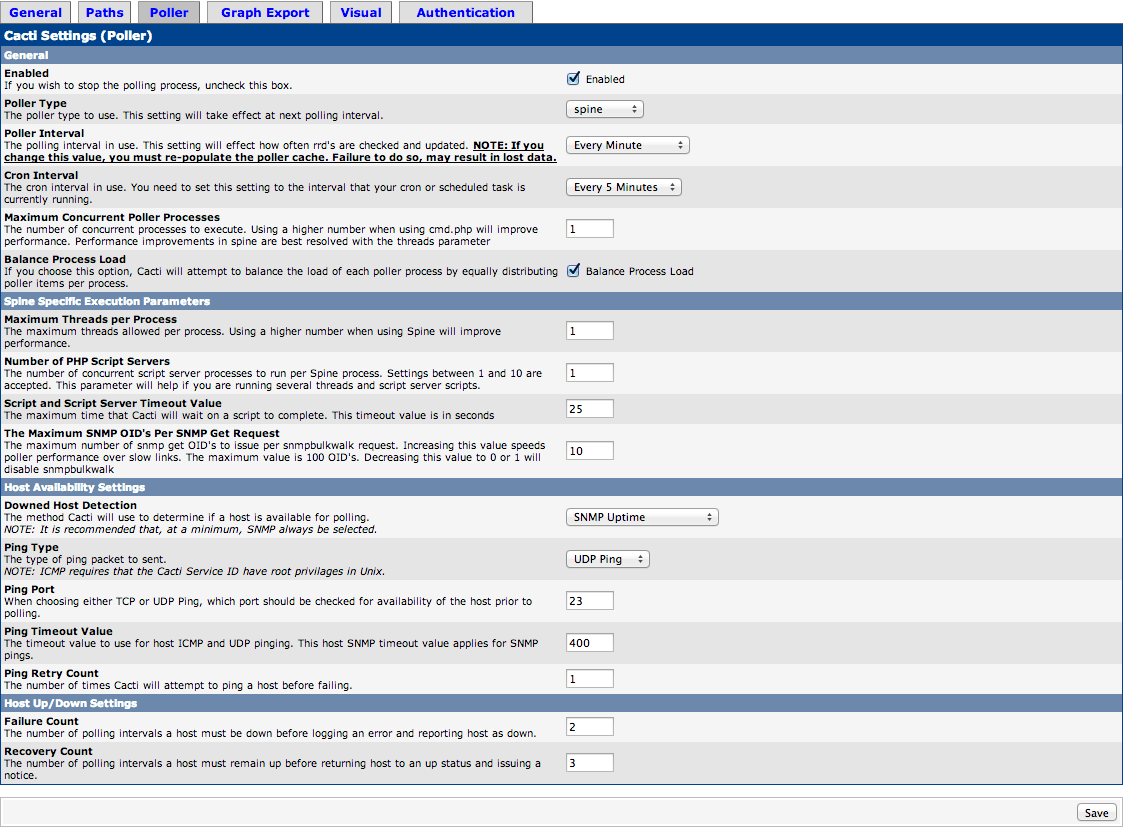
Next, click the "Poller" tab on the navigation settings. Change these options and match what is shown here. Click "Save" when finished.
Poller Type: spine
Poller Interval: Every Minute
Whenever the Poller Interval is changed, the cache must be emptied. To do this, click "System Utilities" under the Utilities heading on the left-hand navigation panel.
Click on "Rebuild Poller Cache" to empty the cache.
Creating Devices and Graphs
Device Settings
To begin graphing, we need to set up device profiles and tell Cacti what to graph. Click "Devices" under the Management heading on the left-hand navigation panel.
First, delete the "Localhost" device because we will be recreating some of the same functionality in the device we will be setting up momentarily. Click the checkbox on the right-hand side, make sure Choose an action has "Delete" selected, and click "Go". Confirm the delete on the following page.
In the upper-right corner of the page, click the "Add" button to add a new device.
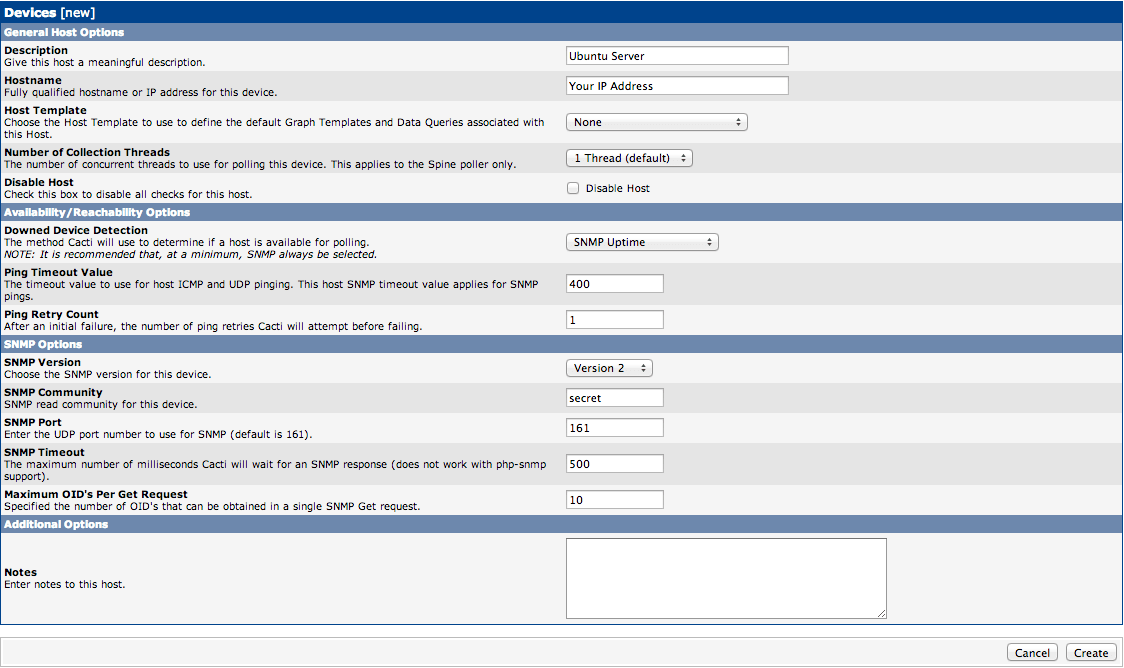
Now, you need to fill out some information that describes your device. Fill out the following fields. Click "Create" when you are finished.
Description: Ubuntu Cacti Server
Hostname: YourIPAddress
Host Template: Local Linux Machine
SNMP Version: Version 2
SNMP Community: secret
Graph Settings
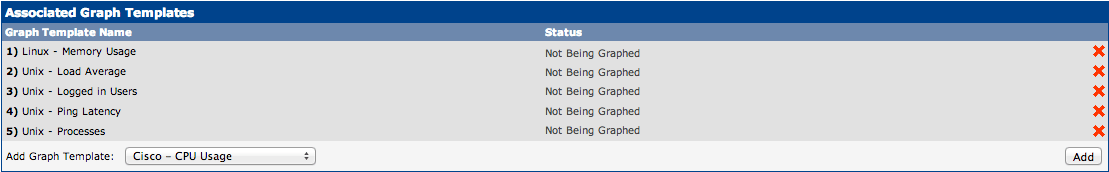
Next, scroll down and create some associated graph templates and associated data queries. Under Associated Graph Templates, select "Unix – Ping Latency" from the drop-down and click "Add". Your selection should match what's shown below.
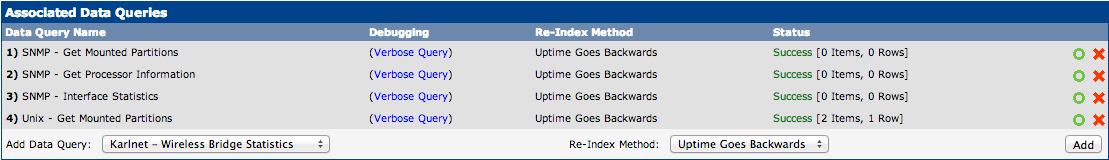
Complete the same steps in the Associated Data Queries section to add "SNMP – Get Mounted Partitions", "SNMP – Get Processor Information", and "SNMP – Interface Statistics". Add each of those and then click "Save".
Next, click "Create Graphs for this Host" at the top-right of the page.
Select each of the right-hand boxes in the light-blue subheadings to select all of the graphs. Click "Create" at the bottom of the page.
On the next page, you can change the color of some of the graphing choices. Make your selections and then click "Create".
At the top of the page, click "Graphs" tab. Click on the last tab in the top-right corner. It should look like a graph.
Your VPS will take a while to generate values for these graphs. It might be five or ten minutes before you even see an empty graph. Sometimes, it will appear that there is a broken image until there is enough data to graph. If you come back in a few hours, you will have some colorful graphs showing some important system statistics.
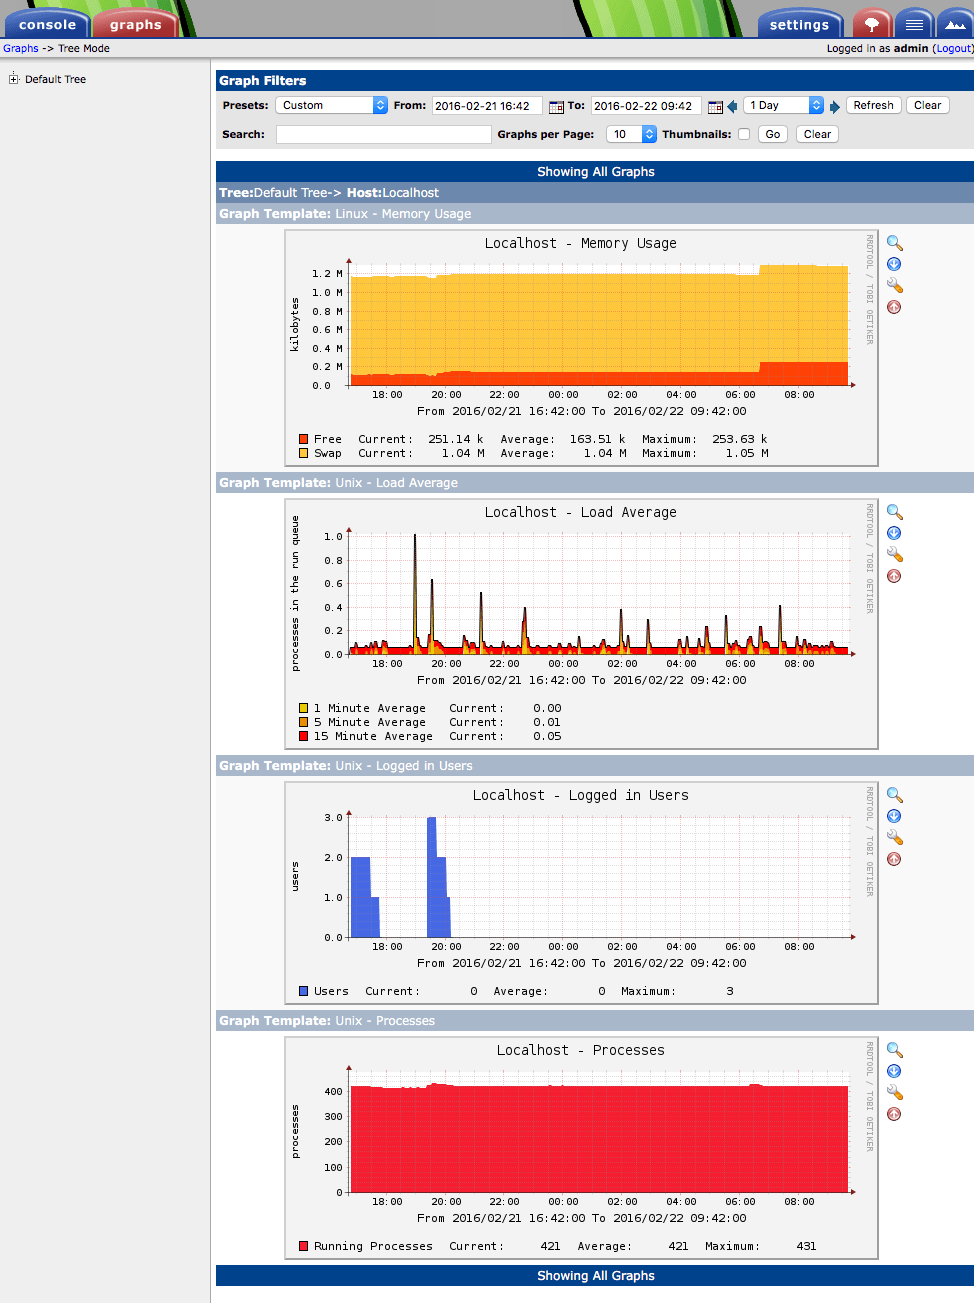
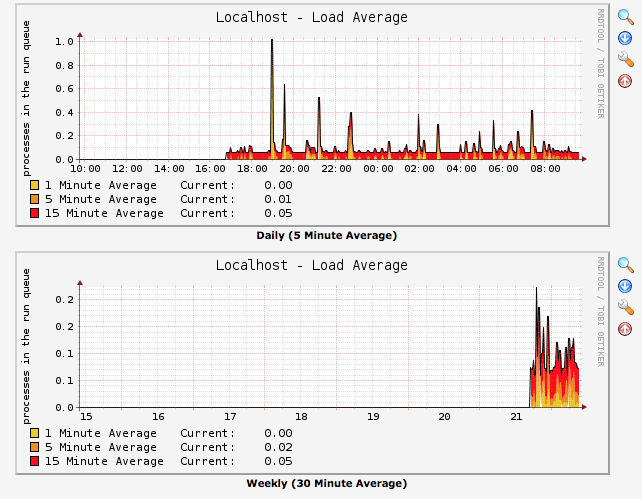
Click on each graph to show daily, weekly, monthly, and yearly graphs for that same resource.
Now you have access to Cacti's graphing capabilities. Cacti becomes more useful with every new cloud server you tell it to monitor, so explore the possibility of adding more servers as Cacti devices.