Logstash
Logstash is a tool for receiving, processing and outputting logs. All kinds of logs. System logs, webserver logs, error logs, application logs, and just about anything you can throw at it. Sounds great, eh?
Logstash provides a powerful pipeline for storing, querying, and analyzing your logs. When using Elasticsearch as a backend data store and Kibana as a front-end reporting tool, Logstash acts as the workhorse. It includes an arsenal of built-in inputs, filters, codecs, and outputs, enabling you to harness some powerful functionality with a small amount of effort.
Elasticsearch
Elasticsearch is a search server based on Lucene. It provides a distributed, multitenant-capable full-text search engine with a RESTful web interface and schema-free JSON documents. Elasticsearch is developed in Java and is released as open source under the terms of the Apache License. Elasticsearch is the second most popular enterprise search engine. It can be used to search all kinds of documents. It provides scalable search, has near real-time search, and supports multitenancy.
Kibana
Kibana is an open source analytics and visualization platform designed to work with Elasticsearch. You use Kibana to search, view, and interact with data stored in Elasticsearch indices. You can easily perform advanced data analysis and visualize your data in a variety of charts, tables, and maps.
Kibana makes it easy to understand large volumes of data. Its simple, browser-based interface enables you to quickly create and share dynamic dashboards that display changes to Elasticsearch queries in real time.
I have install ELK, the main components - Elasticsearch 1.7.0, Logstash 1.5.4 and and Kibana 4.1.1 on Ubuntu 14.04 LTS Server Edition. Storage Nginx access log into Elasticsearch with Logstash and setup browser-based dynamic interface with Kibana.
Install Java 8
Elasticsearch and Logstash require Java, so we will install that now. We will install Oracle Java 8 (update 20 or later) because that is what Elasticsearch recommends. It should, however, work fine with OpenJDK, if we decide to go that route.
- Method 1
Add the Oracle Java PPA to apt:
$ sudo add-apt-repository -y ppa:webupd8team/java
Update my apt package database:
$ sudo apt-get update
Install the latest stable version of Oracle Java 8 with this command (and accept the license agreement that pops up):
$ sudo apt-get -y install oracle-java8-installer
Now that Java 8 is installed, let's install ElasticSearch.
- Method 2
Download Java SE from Oracle official website
I have download jdk-8u60-linux-x64.tar.gz. Create directory
$ sudo mkdir /usr/lib/jvm
Unzip to install directory
$ sudo tar -zxvf jdk-8* -C /usr/lib/jvm
Setup environment variable
$ sudo vim ~/.bashrc
Append following code
# Set Oracle JDK environment
export JAVA_HOME=/usr/lib/jvm/jdk1.8.0_60
export JRE_HOME=${JAVA_HOME}/jre
export CLASSPATH=.:${JAVA_HOME}/lib:${JRE_HOME}/lib
export PATH=${JAVA_HOME}/bin:$PATH
Setup default JDK version of system
$ sudo update-alternatives --install /usr/bin/java java /usr/lib/jvm/jdk1.8.0_60/bin/java 300
$ sudo update-alternatives --install /usr/bin/javac javac /usr/lib/jvm/jdk1.8.0_60/bin/javac 300
$ sudo update-alternatives --install /usr/bin/jar jar /usr/lib/jvm/jdk1.8.0_60/bin/jar 300
$ sudo update-alternatives --install /usr/bin/javah javah /usr/lib/jvm/jdk1.8.0_60/bin/javah 300
$ sudo update-alternatives --install /usr/bin/javap javap /usr/lib/jvm/jdk1.8.0_60/bin/javap 300
$ sudo update-alternatives --config java
Test installation
$ java -version
Install Elasticsearch
Install Elasticsearch please reference the post Elasticsearch Cluster on Ubuntu
After install edit the configuration
$ sudo vim /etc/elasticsearch/elasticsearch.yml
To restrict outside access to my Elasticsearch instance (port 9200), so outsiders can't read my data or shutdown my Elasticsearch cluster through the HTTP API. Find the line that specifies network.host, uncomment it, and replace its value with IP address so it looks like this:
network.host: 192.168.171.129
Save and exit elasticsearch.yml.
Now restart Elasticsearch:
$ sudo service elasticsearch restart
Then run the following command to start Elasticsearch on boot up:
$ sudo update-rc.d elasticsearch defaults 95 10
Now that Elasticsearch is up and running, let's install Kibana.
Install Kibana
Download Kibana 4 to our home directory with the following command:
$ cd ~; wget https://download.elastic.co/kibana/kibana/kibana-4.1.1-linux-x64.tar.gz
Extract Kibana archive with tar:
$ tar xvf kibana-*.tar.gz
Open the Kibana configuration file for editing:
$ vim ~/kibana-4*/config/kibana.yml
In the Kibana configuration file, find the line that specifies host, and replace the IP address (0.0.0.0 by default) with real IP address:
host: "192.168.171.129"
Save and exit. This setting makes it so Kibana will only be accessible to the IP address. This is fine because we will use an Nginx reverse proxy to allow external access.
Let's copy the Kibana files to a more appropriate location. Create the /opt directory with the following command:
$ sudo mkdir -p /opt/kibana
Now copy the Kibana files into my newly-created directory:
$ sudo cp -R ~/kibana-4*/* /opt/kibana/
Kibana can be started by running /opt/kibana/bin/kibana, but we want it to run as a service. Download a Kibana init script with this command:
$ cd /etc/init.d && sudo wget https://raw.githubusercontent.com/akabdog/scripts/master/kibana4_init && sudo mv kibana4_init kibana4
Now enable the Kibana service, and start it:
$ sudo chmod +x /etc/init.d/kibana4
$ sudo update-rc.d kibana4 defaults 96 9
$ sudo service kibana4 start
Before we can use the Kibana web interface, we have to set up a reverse proxy. Let's do that now, with Nginx.
Use apt to install Nginx
$ sudo apt-get install nginx
Now open the Nginx default server block in my favorite editor.
$ sudo vim /etc/nginx/sites-available/default
Delete the file's contents, and paste the following code block into the file. Be sure to update the server_name to match my server's name:
server {
    listen 80;

    server_name example.com;
    access_log  /var/log/nginx/kibana.myhost.org.access.log;

}
Install Logstash
Create the Logstash source list
$ echo 'deb http://packages.elasticsearch.org/logstash/1.5/debian stable main' | sudo tee /etc/apt/sources.list.d/logstash.list
Update our apt package database:
$ sudo apt-get update
Install Logstash with this command:
$ sudo apt-get install logstash
Logstash is installed but it is not configured yet.
Configure Logstash
Logstash configuration files are in the JSON-format, and reside in /etc/logstash/conf.d. The configuration consists of three sections: inputs, filters, and outputs.
Let's create a configuration file called logstash-sample.conf
$ sudo vim /etc/logstash/conf.d/logstash-sample.conf
Insert the following input configuration
input {
    file {
        #type => "nginx_access"
        codec => "json"
        path  => ["/var/log/nginx/kibana.myhost.org.access.log"]
    }
}
output {
    elasticsearch {
        embedded => false
        protocol => "http"
        host     => "192.168.171.129"
        port     => 9200
    }
}
Now, start Logstash to put our configuration changes into effect:
$ nohup /opt/logstash/bin/logstash -f /etc/logstash/conf.d/logstash-sample.conf &
In a web browser, visit public IP address on 5601 port (http://192.168.171.129:5601)
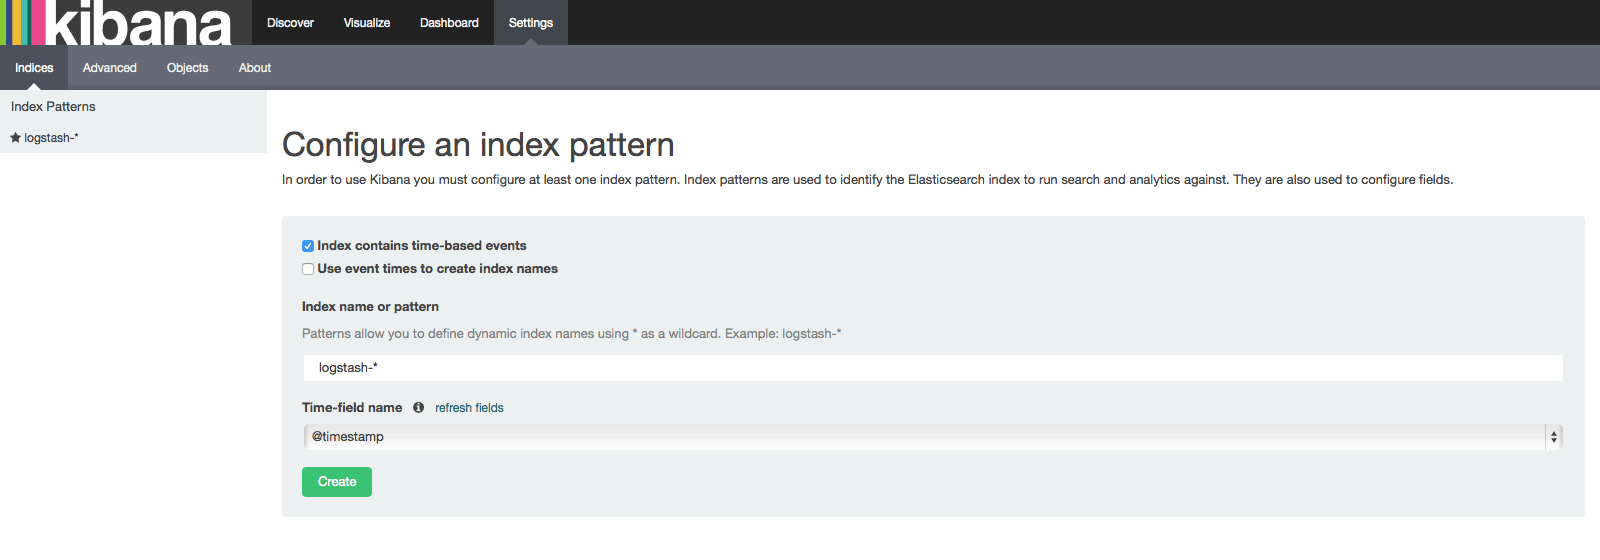
Go ahead and select @timestamp from the dropdown menu, then click the Create button to create the first index.
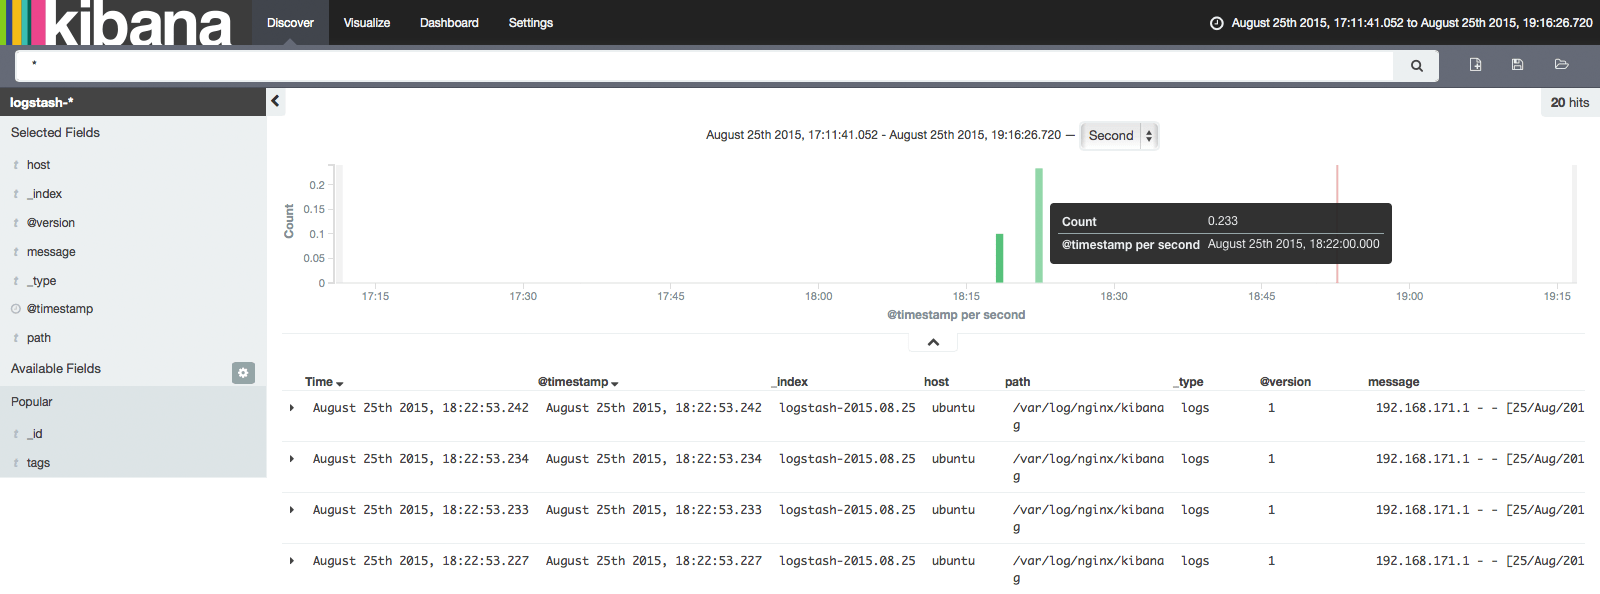
Now click the Discover link in the top navigation bar. By default, this will show you all of the log data over the last 15 minutes. We should see a histogram with log events, with log messages below:
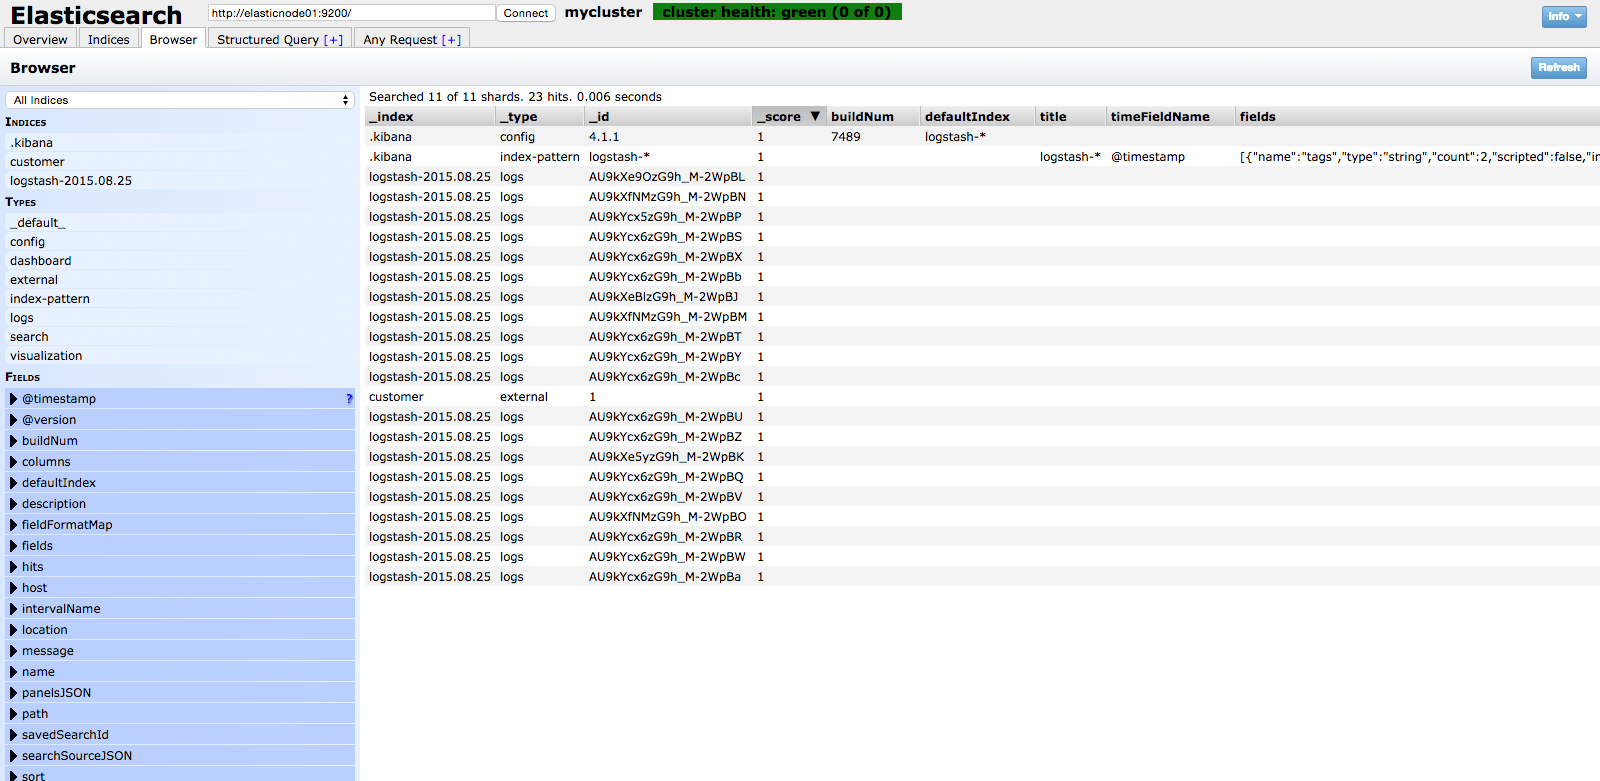
Elasticsearch Browser
Now that my Nginx access logs are centralized via Elasticsearch and Logstash, and I'm able to visualize them with Kibana 4.
Reference Article How To Install Elasticsearch, Logstash, and Kibana 4 on Ubuntu 14.04