Introduction
Zabbix is an enterprise open source monitoring solution for networks and applications, created by Alexei Vladishev. It is designed to monitor and track the status of various network services, servers, and other network hardware.
Zabbix uses MySQL, PostgreSQL, SQLite, Oracle or IBM DB2 to store data. Its backend is written in C and the web frontend is written in PHP. Zabbix offers several monitoring options:
Simple checks can verify the availability and responsiveness of standard services such as SMTP or HTTP without installing any software on the monitored host.
A Zabbix agent can also be installed on UNIX and Windows hosts to monitor statistics such as CPU load, network utilization, disk space, etc.
As an alternative to installing an agent on hosts, Zabbix includes support for monitoring via SNMP, TCP and ICMP checks, as well as over IPMI, JMX, SSH, Telnet and using custom parameters. Zabbix supports a variety of real-time notification mechanisms, including XMPP.
Installing the Zabbix Server
Let's installing the Zabbix server on the Ubuntu 14.04 LTS from packages.
Zabbix 2.4 for Ubuntu 14.04 LTS:
$ wget http://repo.zabbix.com/zabbix/2.4/ubuntu/pool/main/z/zabbix-release/zabbix-release_2.4-1+trusty_all.deb
$ sudo dpkg -i zabbix-release_2.4-1+trusty_all.deb
$ sudo apt-get update
Installing Zabbix packages
Install Zabbix packages. dbconfig-common will create the database and populate the initial schema and data automatically. If backend db is located on a different server, please set dbc_remote_questions_default='true' in /etc/dbconfig-common/config.
Example for Zabbix server and web frontend with mysql database.
$ sudo apt-get install zabbix-server-mysql zabbix-frontend-php
Example for installing Zabbix agent only.
$ sudo apt-get install zabbix-agent
Editing PHP configuration for Zabbix frontend
Apache configuration file for Zabbix frontend is located in /etc/apache2/conf.d/zabbix. Some PHP settings are already configured.
php_value max_execution_time 300
php_value memory_limit 128M
php_value post_max_size 16M
php_value upload_max_filesize 2M
php_value max_input_time 300
# php_value date.timezone Europe/Riga
It's necessary to uncomment the date.timezone setting and set the correct timezone for you. After changing the configuration file restart the apache web server.
$ sudo service apache2 restart
Zabbix frontend is available at http://zabbix-frontend-hostname/zabbix in the browser. You will be presented with a login screen. The default credentials are as follows:
When you have logged in, click on the "Configuration" button, and then "Hosts" in the top navigation bar.
Username = admin
Password = zabbix
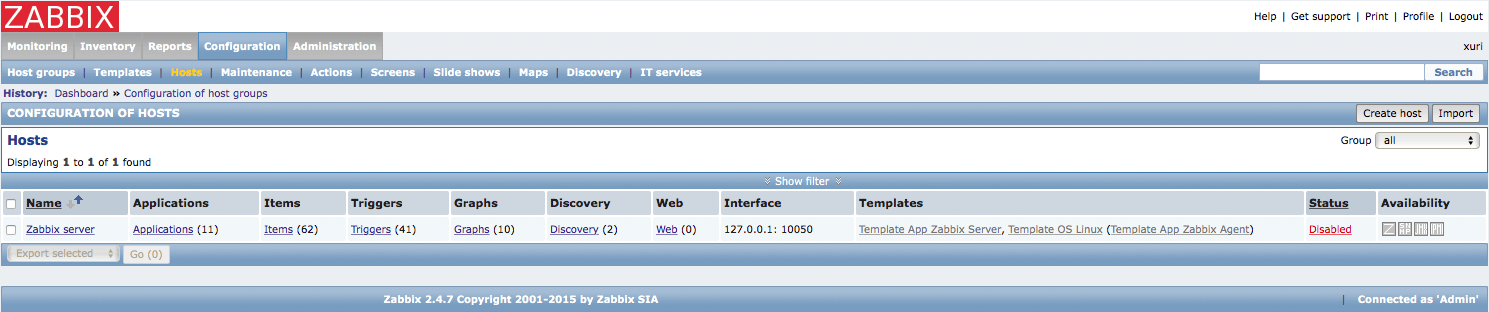
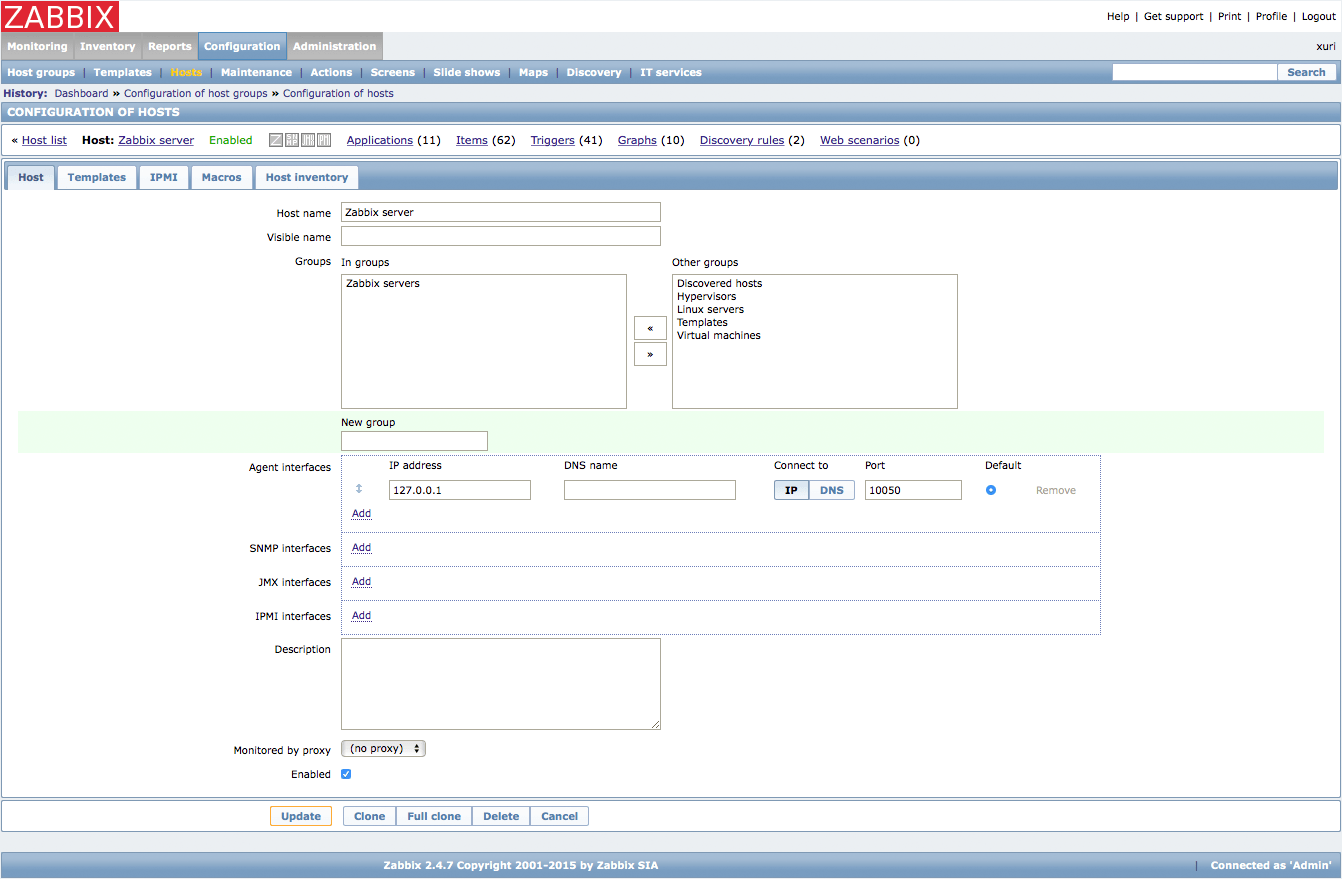
Click on the name of the server (by default, this should be "Zabbix server"). This will open the host configuration page.
Adjust the Hostname to reflect the hostname of your Zabbix server (this should be the same hostname you entered in the agent configuration for the server machine).
At the bottom, check out "Enabled". Click save.
You will be dopped back to the Hosts configuration page. Re-click on the hostname again.
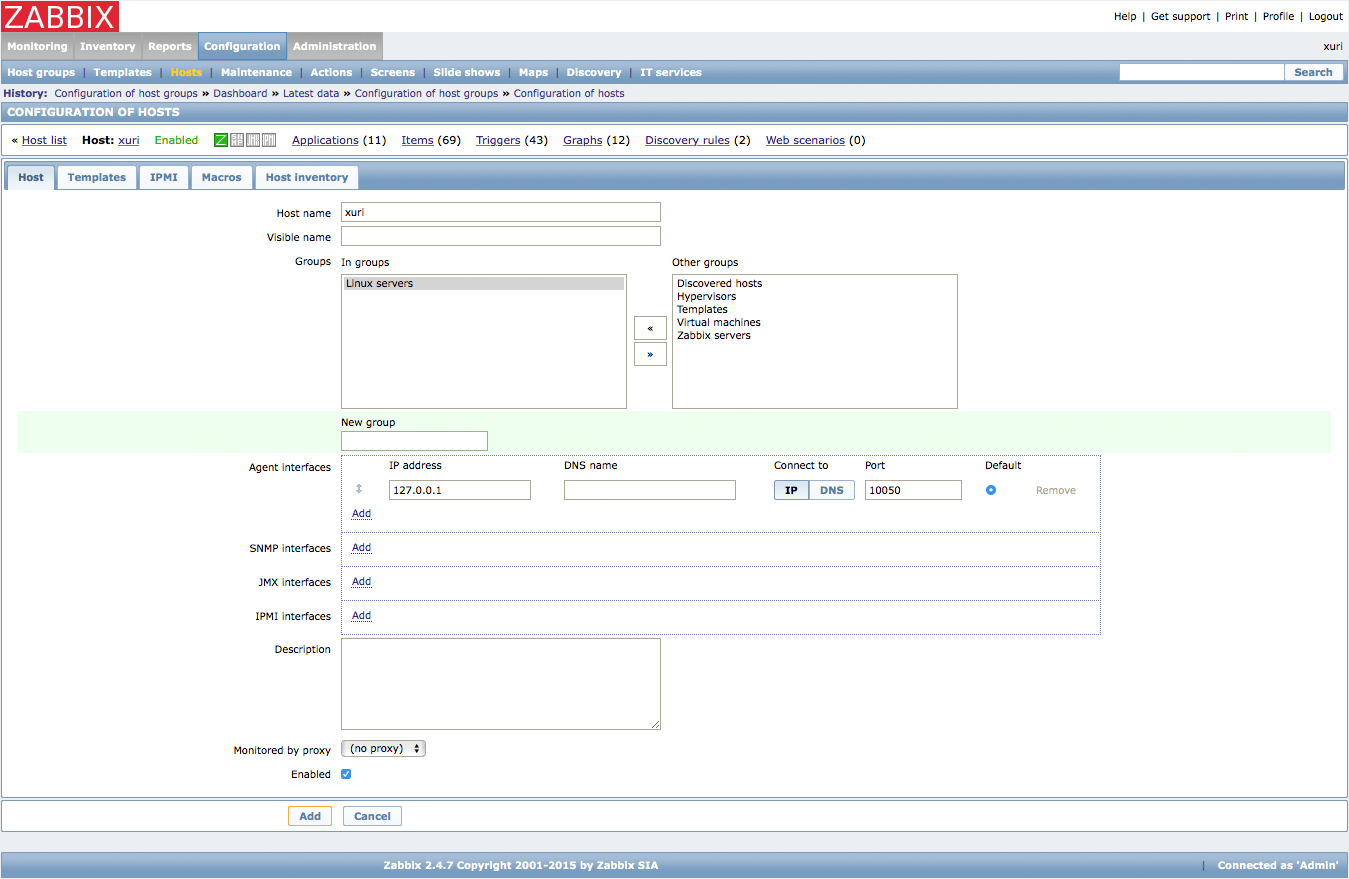
This time, click on the "Clone" button at the bottom of the page.
We will configure this to reflect the settings of the client machine. Change the hostname and the IP address to reflect the correct information from the client agent file.
In the "groups" section, select "Zabbix servers" and click the right arrow icon to remove that group. Select the "Linux servers" and click the left arrow icon to add that group setting.
Click "Save" at the bottom.
After a few minutes, you should be able to see both computers by going to "Monitoring" and then clicking on "Graph" you will see a graphical representation of the data points that have been collected:
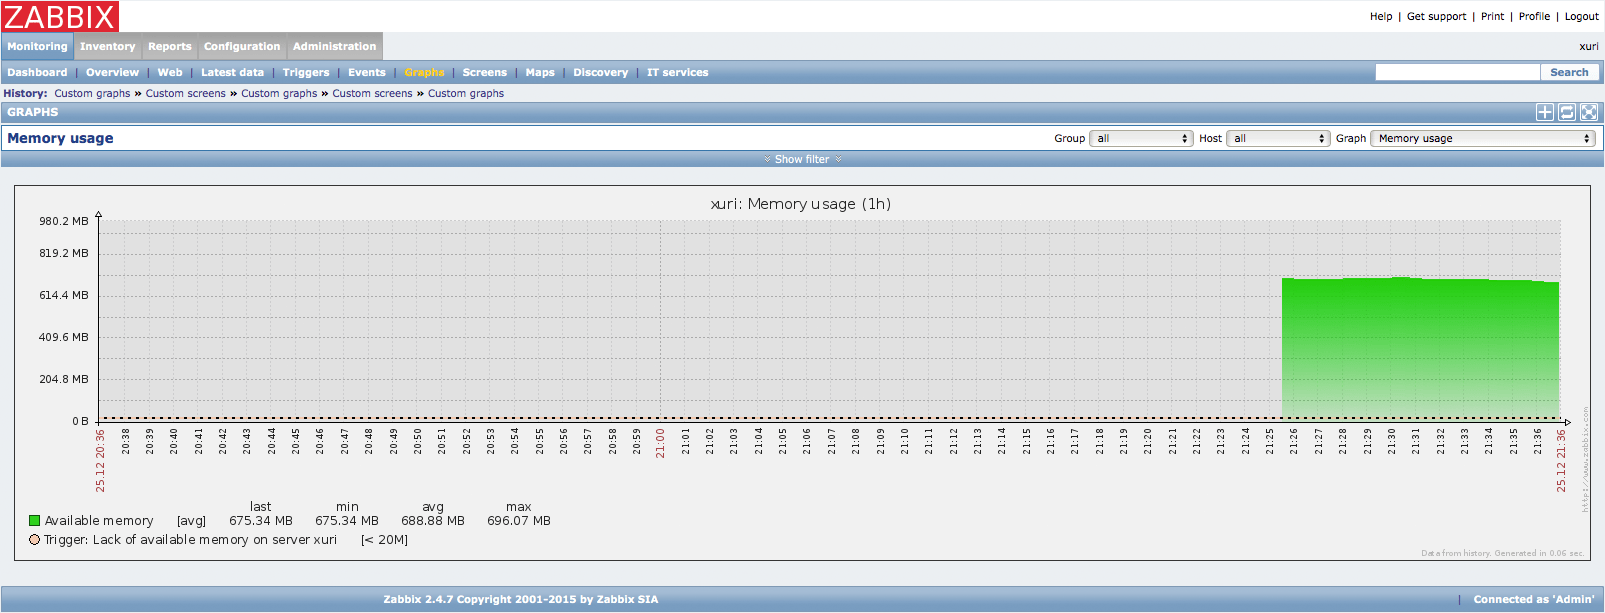
As with all monitoring software, these graphs will become more interesting the longer the server runs.
There are many other options that you can utilize to keep an eye on your servers.
Reference Document Zabbix Documentation 3.0
Related Article Install the Cacti Server Monitor on Ubuntu Server