Prometheus
Prometheus is an open-source systems monitoring and alerting toolkit originally built at SoundCloud. Since its inception in 2012, many companies and organizations have adopted Prometheus, and the project has a very active developer and user community. It is now a standalone open source project and maintained independently of any company. To emphasize this, and to clarify the project's governance structure, Prometheus joined the Cloud Native Computing Foundation in 2016 as the second hosted project, after Kubernetes.
Grafana
Grafana is an open-source, general purpose dashboard and graph composer, which runs as a web application. It supports graphite, InfluxDB or opentsdb as backends.
Downloading and running Prometheus without Docker
$ tar xvfz prometheus-*.tar.gz
$ cd prometheus-*
Configuring Prometheus to monitor itself prometheus.yml
# my global config
global:
  scrape_interval:     15s # Set the scrape interval to every 15 seconds. Default is every 1 minute.
  evaluation_interval: 15s # Evaluate rules every 15 seconds. The default is every 1 minute.
  # scrape_timeout is set to the global default (10s).

# Alertmanager configuration
alerting:
  alertmanagers:
  - static_configs:
    - targets:
      # - alertmanager:9093

# Load rules once and periodically evaluate them according to the global 'evaluation_interval'.
rule_files:
  # - "first_rules.yml"
  # - "second_rules.yml"

# A scrape configuration containing exactly one endpoint to scrape:
# Here it's Prometheus itself.
scrape_configs:
  # The job name is added as a label `job=<job_name>` to any timeseries scraped from this config.
  - job_name: 'prometheus'

    # metrics_path defaults to '/metrics'
    # scheme defaults to 'http'.

    static_configs:
    - targets: ['localhost:9090']
Starting Prometheus
$ ./prometheus --config.file=prometheus.yml --web.listen-address=:8000
Metrics endpoint: http://localhost:8000/metrics
Prometheus console: http://localhost:8000/graph
Job metrics: http://lcoalhost:8000/api/v1/label/job/values
Install Grafana
Downloading and install Grafana.
package main

import (
    "log"
    "net/http"
    "os"
    "time"

    "github.com/prometheus/client_golang/prometheus"
    "github.com/prometheus/client_golang/prometheus/promhttp"
    "github.com/shirou/gopsutil/mem"
)

func main() {
    // init log service
    logger := log.New(os.Stdout, "[Memory]", log.Lshortfile|log.Ldate|log.Ltime)

    // init http handler
    http.Handle("/metrics", promhttp.Handler())

    // init container
    memoryPercent := prometheus.NewGaugeVec(prometheus.GaugeOpts{
        Name: "memory_percent",
        Help: "memory use percent",
    },
        []string{"percent"},
    )
    prometheus.MustRegister(memoryPercent)

    go func() {
        logger.Println("ListenAndServe at:0.0.0.0:8080")
        err := http.ListenAndServe("localhost:8080", nil)

        if err != nil {
            logger.Fatal("ListenAndServe: ", err)
        }
    }()

    // collection memory use percent
    for {
        logger.Println("start collect memory used percent!")
        v, err := mem.VirtualMemory()
        if err != nil {
            logger.Println("get memory use percent error:%s", err)
        }
        usedPercent := v.UsedPercent
        logger.Println("get memory use percent:", usedPercent)
        memoryPercent.WithLabelValues("usedMemory").Set(usedPercent)
        time.Sleep(time.Second * 2)
    }
}
Prometheus client metrics endpoint: http://localhost:9090/metrics
Check instance alreday registered on Prometheus:
$ curl http://localhost:8000/api/v1/targets
{
    "status": "success",
    "data":
    {
        "activeTargets": [
        {
            "discoveredLabels":
            {
                "__address__": "localhost:9090",
                "__metrics_path__": "/metrics",
                "__scheme__": "http",
                "job": "prometheus"
            },
            "labels":
            {
                "instance": "localhost:9090",
                "job": "prometheus"
            },
            "scrapeUrl": "http://localhost:9090/metrics",
            "lastError": "",
            "lastScrape": "2019-01-07T18:32:58.541151856+08:00",
            "health": "up"
        }],
        "droppedTargets": []
    }
}
Grafana config file located at /usr/share/grafana/conf/defaults.ini
# The http port to use, default 3000
http_port = 8080

# The public facing domain name used to access grafana from a browser
domain = 0.0.0.0
Start Grafana server
$ sudo grafana-server --homepath "/usr/share/grafana"
Using the expression browser http://localhost:8080, default user name and password is admin.
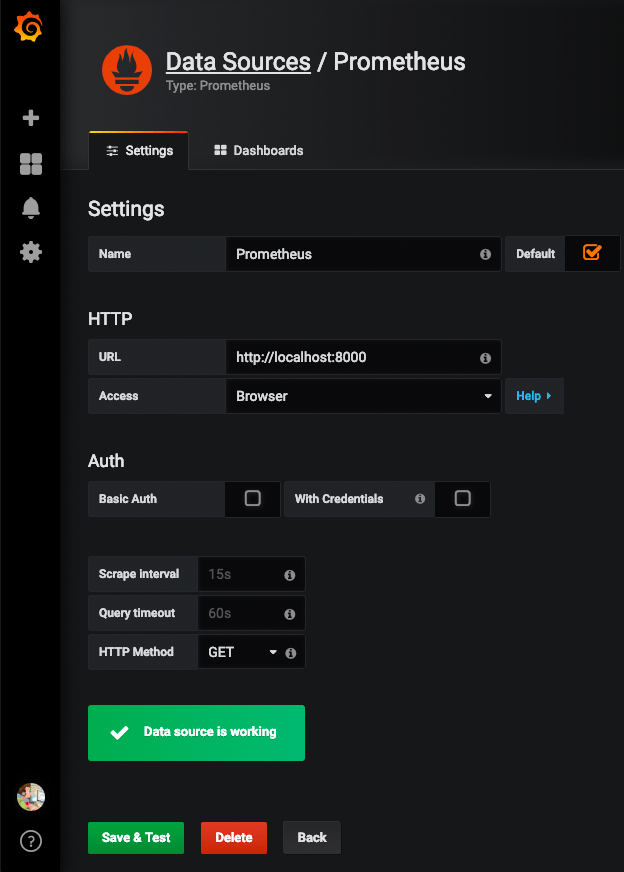
- Add data source and set "Data Sources"
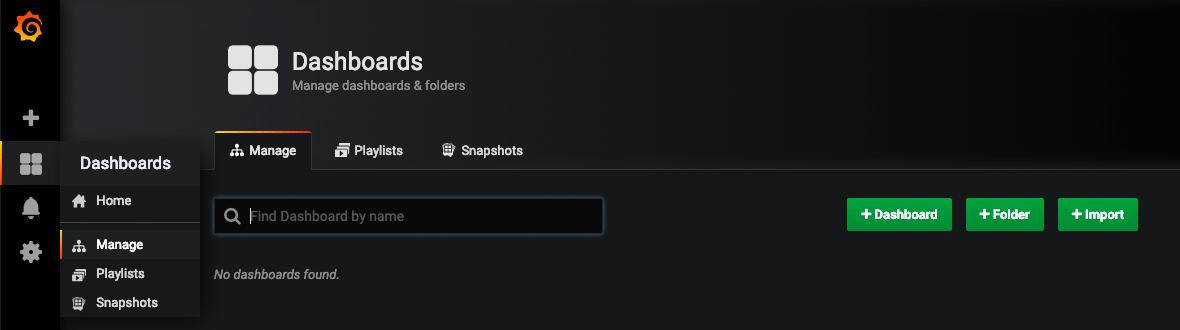
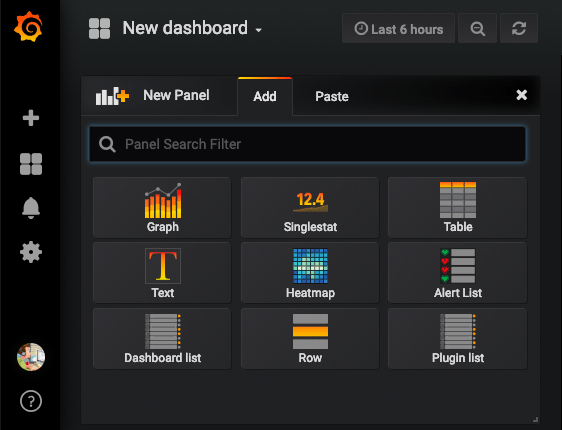
- Add dashboard in Dashboards manage
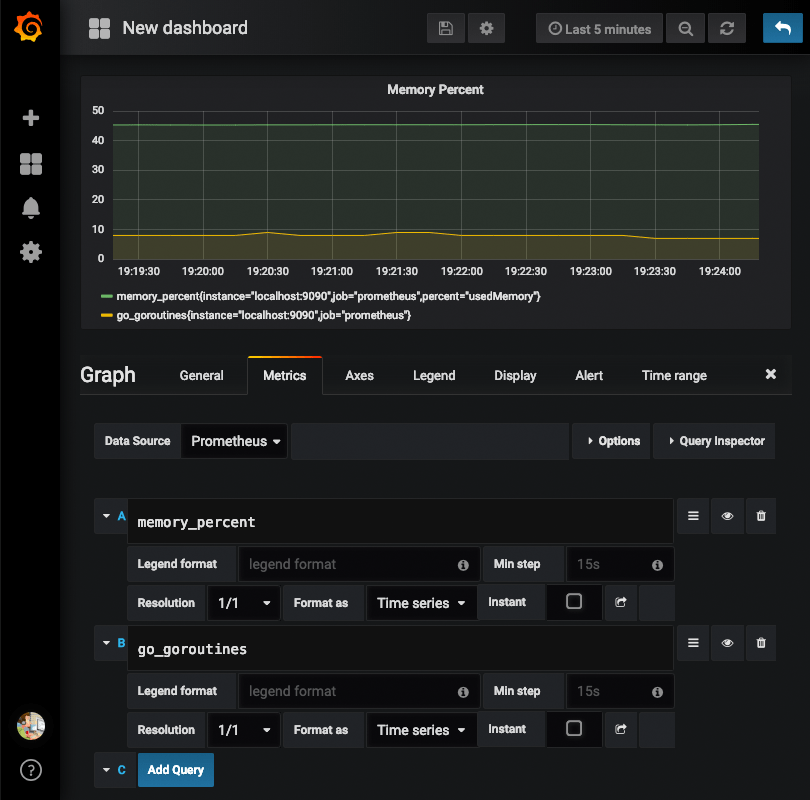
- Add Graph dashboard
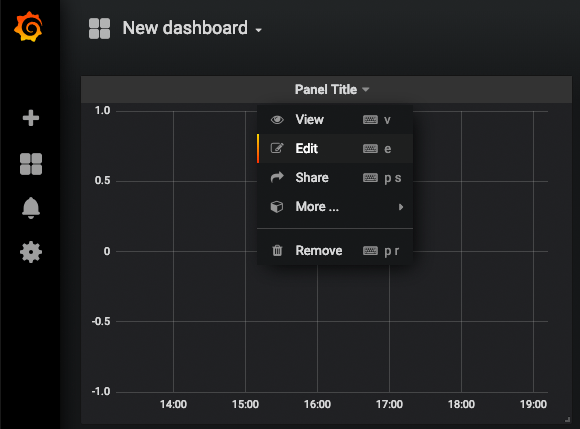
- Edit dashboard
- Add metrics in the dashboard