Introduction
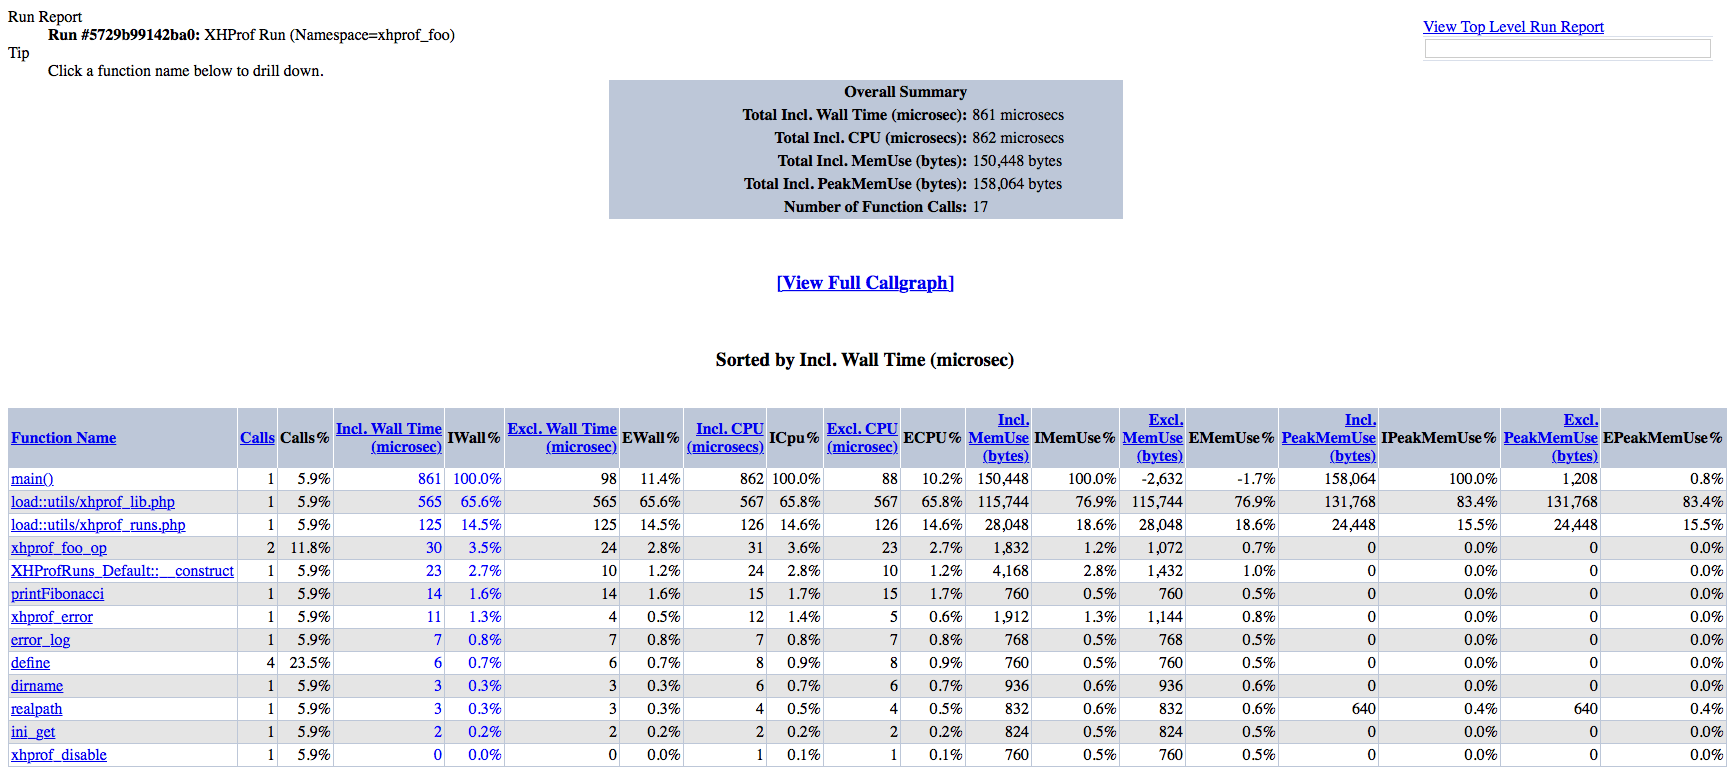
XHProf is a function-level hierarchical profiler for PHP and has a simple HTML based navigational interface. The raw data collection component is implemented in C (as a PHP extension).
Install XHProf on OS X
$ brew install php56-xhprof
For example, profiling fibonacci.php:
<?php

xhprof_enable(XHPROF_FLAGS_CPU + XHPROF_FLAGS_MEMORY);
$XHPROF_ROOT = realpath(dirname(__FILE__) .'/..');
include_once $XHPROF_ROOT . "/xhprof-0.9.4/xhprof-0.9.4/xhprof_lib/utils/xhprof_lib.php";
include_once $XHPROF_ROOT . "/xhprof-0.9.4/xhprof-0.9.4/xhprof_lib/utils/xhprof_runs.php";
$xhprof_runs = new XHProfRuns_Default();

function printFibonacci($n) {
    $first  = 0;
    $second = 1;
    echo "Fibonacci Series \n";
    echo $first . ' ' . $second . ' ';
    for ($i = 2; $i < $n; $i++) {
        $third  = $first + $second;
        echo $third . ' ';
        $first  = $second;
        $second = $third;
    }
}

// Function call to print Fibonacci series upto 30 numbers.
printFibonacci(30);

$xhprof_data = xhprof_disable();
$run_id      = $xhprof_runs->save_run($xhprof_data, "xhprof_foo");
echo '<a href="<xhprof-ui-address>/xhprof_html/index.php?run='.$run_id.'&source=xhprof_foo" target="_blank">count</a>';
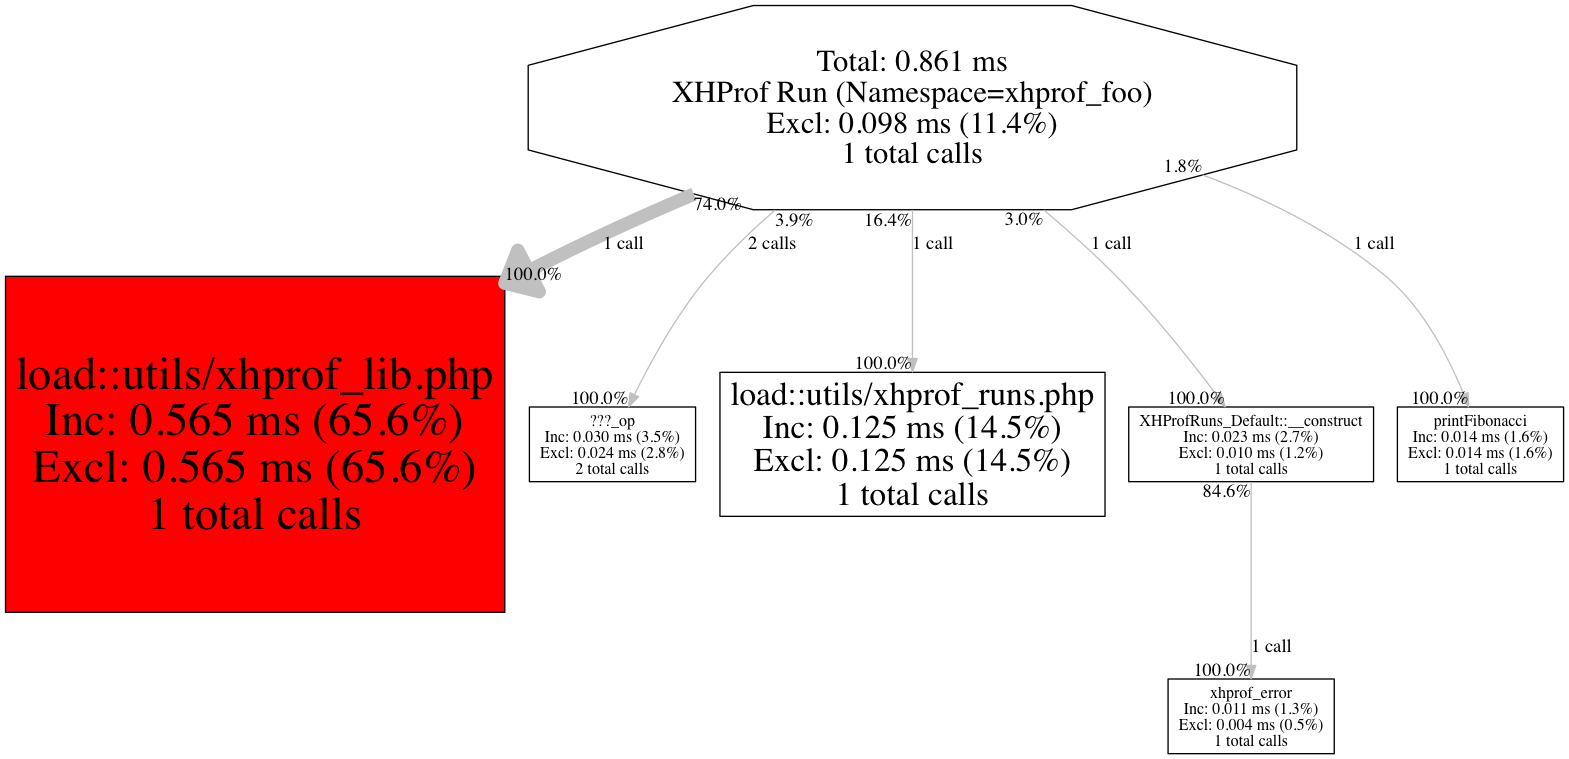
Viewing Callgraphs
Generation of callgraphs required graphviz utility installed.
Use XHprof and PHP on Windows
Download old version releases of PHP from archives and download XHprof for Windows from windows.php.net.
Edit php.ini:
[xhprof]
extension = ./ext/php_xhprof.dll
xhprof.output_dir = ./dev
Related Article
Debugging with Xdebug and PhpStorm on OS X
Profiling PHP Applications with Xdebug