Introduction
Xdebug is a PHP extension for powerful debugging. It supports stack and function traces, profiling information and memory allocation and script execution analysis.
Install Xdebug on Windows
Download php_xdebug.dll from official website. Edit php.ini like this:
[xdebug]

xdebug.profiler_enable         = 1
xdebug.profiler_enable_trigger = 1
xdebug.profiler_output_name    = cachegrind.out.%p
xdebug.profiler_output_dir     = "..\ext\xdebug_profilers"
xdebug.trace_output_dir        = "..\ext\xdebug_traces"
xdebug.auto_trace              = 0
xdebug.collect_params          = 4
xdebug.collect_return          = 1
xdebug.show_mem_delta          = 1

zend_extension                 = "..\ext\php_xdebug.dll"
We can get more configuration information from the official documents. After edited the config file, restart the web server.
<?php
    register_shutdown_function('xdebug_stop_trace');
    xdebug_start_trace("..\ext\xdebug_traces");
    //  Code to trace ...
    xdebug_stop_trace();
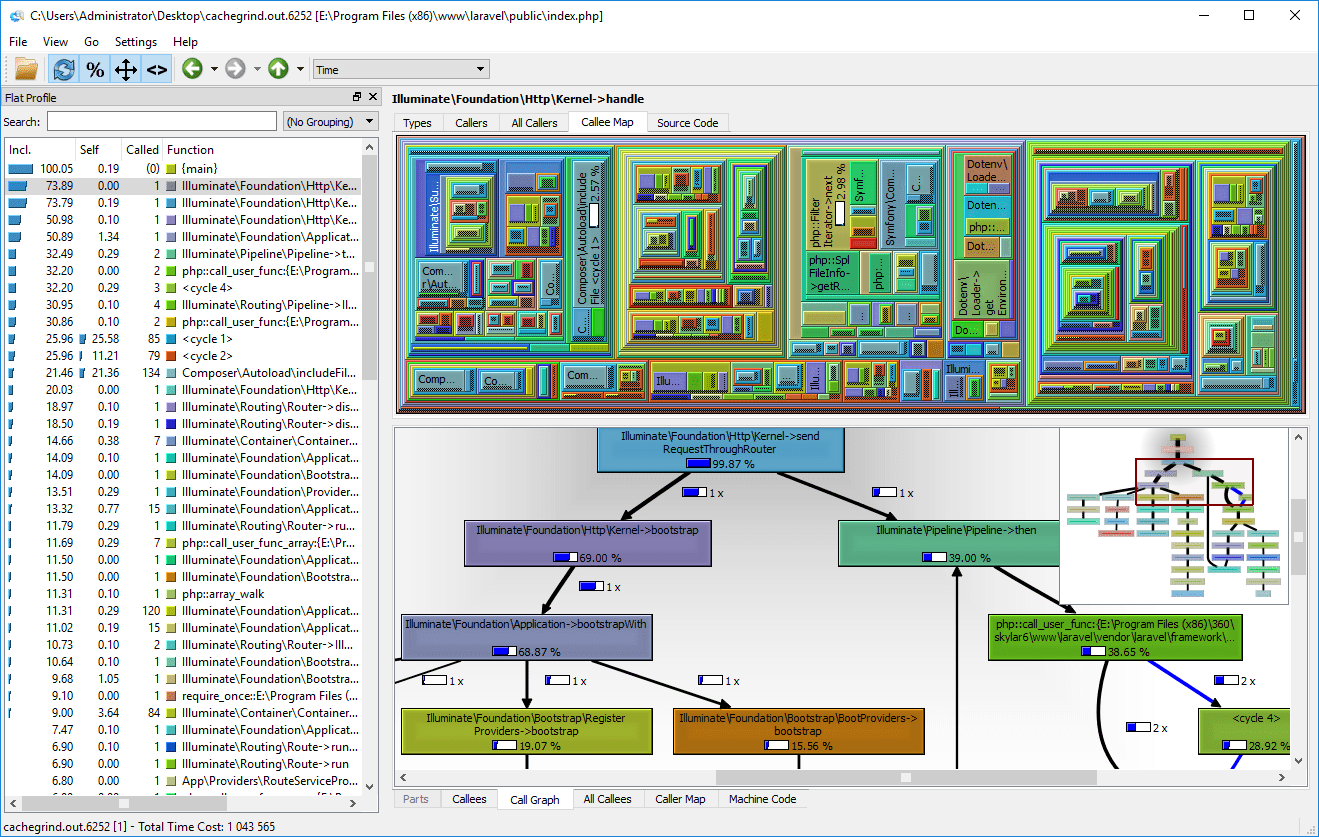
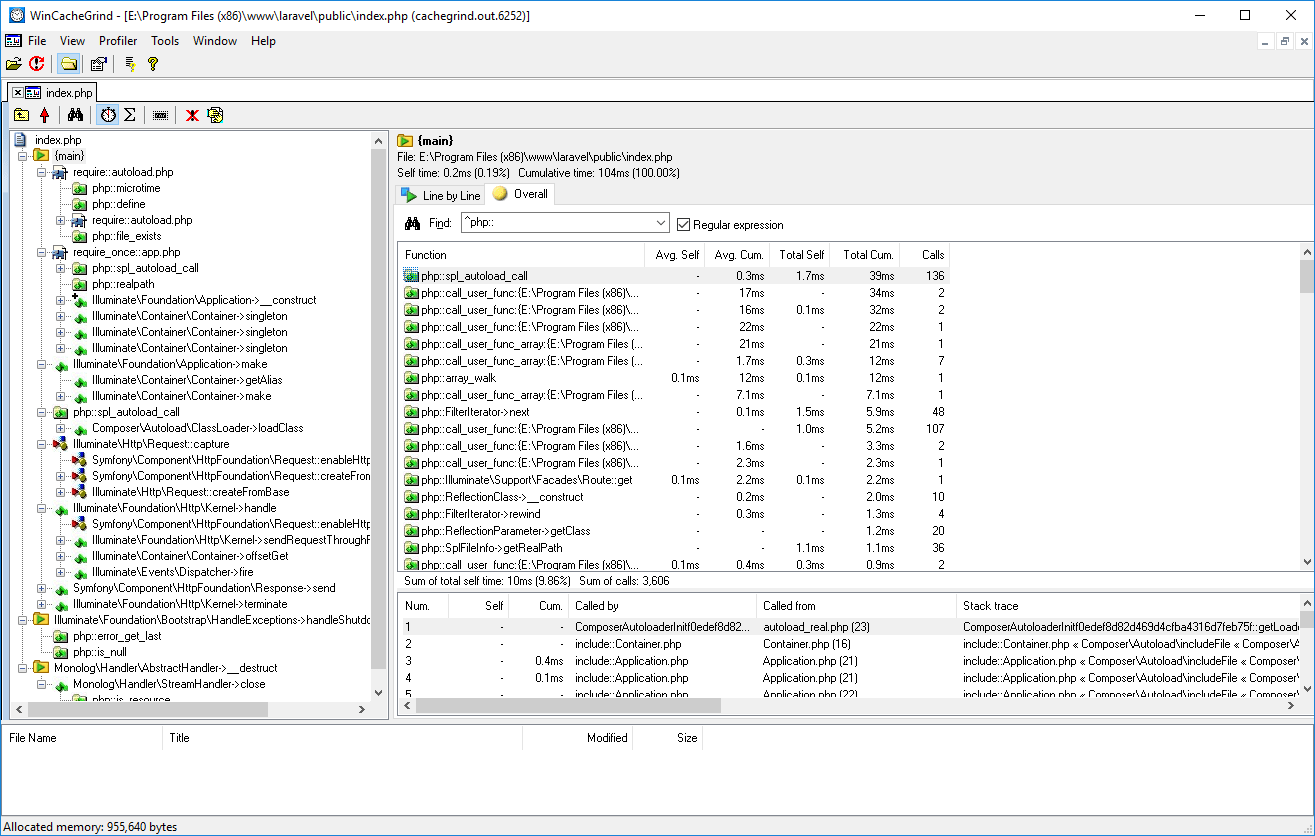
WinCacheGrind is a viewer for cachegrind.out files generated by Xdebug and QCacheGrind (KCacheGrind) Windows build is a GUI to parse and view Xdebug trace files. If you got MSVCP100.dll Missing error, download and install Microsoft Visual C++ 2010 Redistributable Package (x86, x64).
Related Article
Debugging with Xdebug and PhpStorm on OS X
Profiling PHP Applications with XHProf