Xdebug is a PHP extension which provides debugging and profiling capabilities. It uses the DBGp debugging protocol.
PhpStorm IDE is an intelligent PHP IDE with refactorings, code completion, on-the-fly code analysis and coding productivity orientation.
PHP         5.5.37
PhpStorm    2016.1 Build #PS-145.258
Xdebug      2.4.0
Homebrew    0.9.9
Install Xdebug for PHP
Homebrew make install Xdebug simple
$ brew install php55-xdebug
We can get those info of installation with the following command:
$ brew info php55-xdebug
To check Xdebug was installed used the php-cli command or phpinfo(). Both should contain the Xdebug configuration.
$ php -i | grep xdebug
Configure Xdebug and PhpStorm
If you are using php-fpm, change the default port of Xdebug because 9000 is taken by php-fpm on machine. Configure /usr/local/etc/php/5.5/conf.d/ext-xdebug.ini like this:
[xdebug]
zend_extension="/usr/local/opt/php55-xdebug/xdebug.so"

xdebug.remote_enable=1
xdebug.remote_port=9001
xdebug.remote_handler="dbgp"
xdebug.remote_host="localhost"
xdebug.idekey=PHPSTORM
Restart PHP
$ brew services restart php55
And also change the port on PhpStorm:
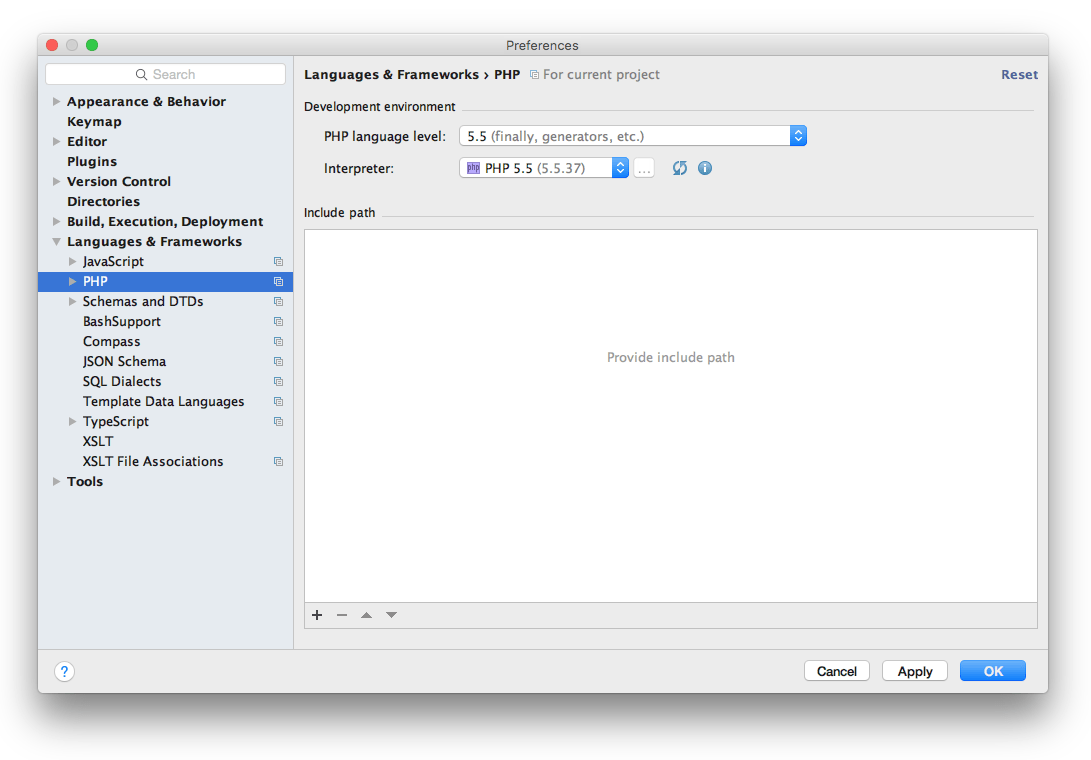
Preferences → Languages & Frameworks → PHP → Development environment: Setting PHP language level and Interpretr
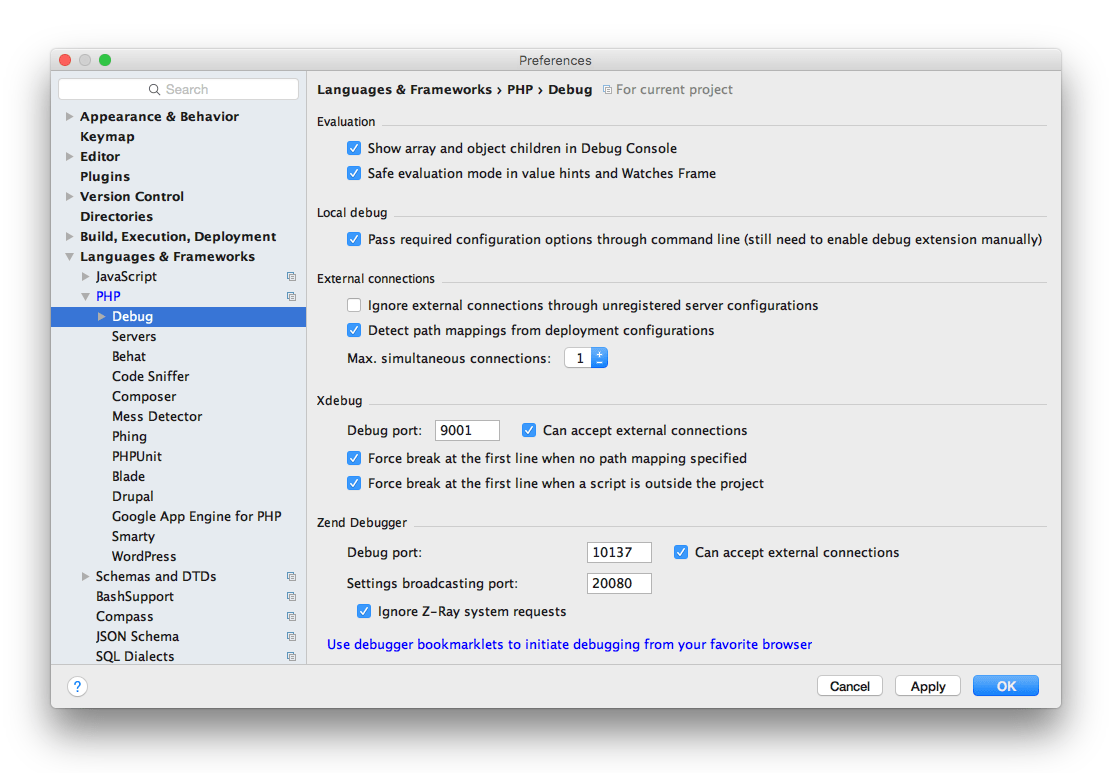
Preferences → Languages & Frameworks → PHP → Debug: Setting Xdebug port to 9001
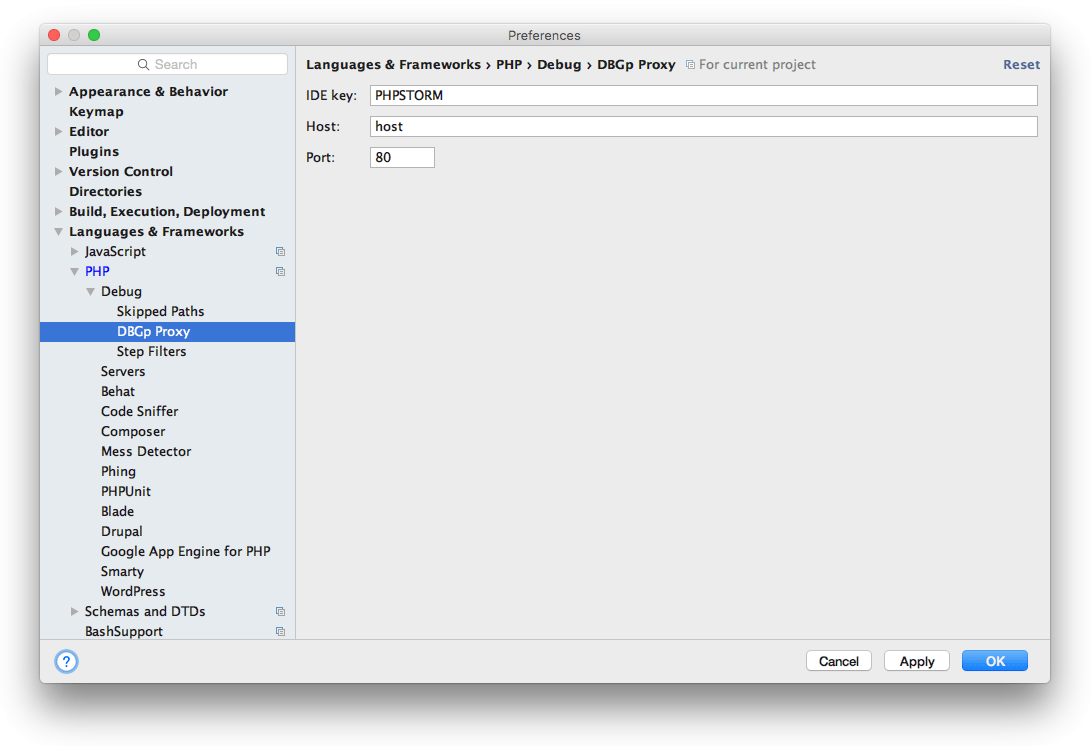
Preferences → Languages & Frameworks → PHP → Debug → DBGp Proxy: Set IDE Key to PHPSTORM, Host to host and Port is 80
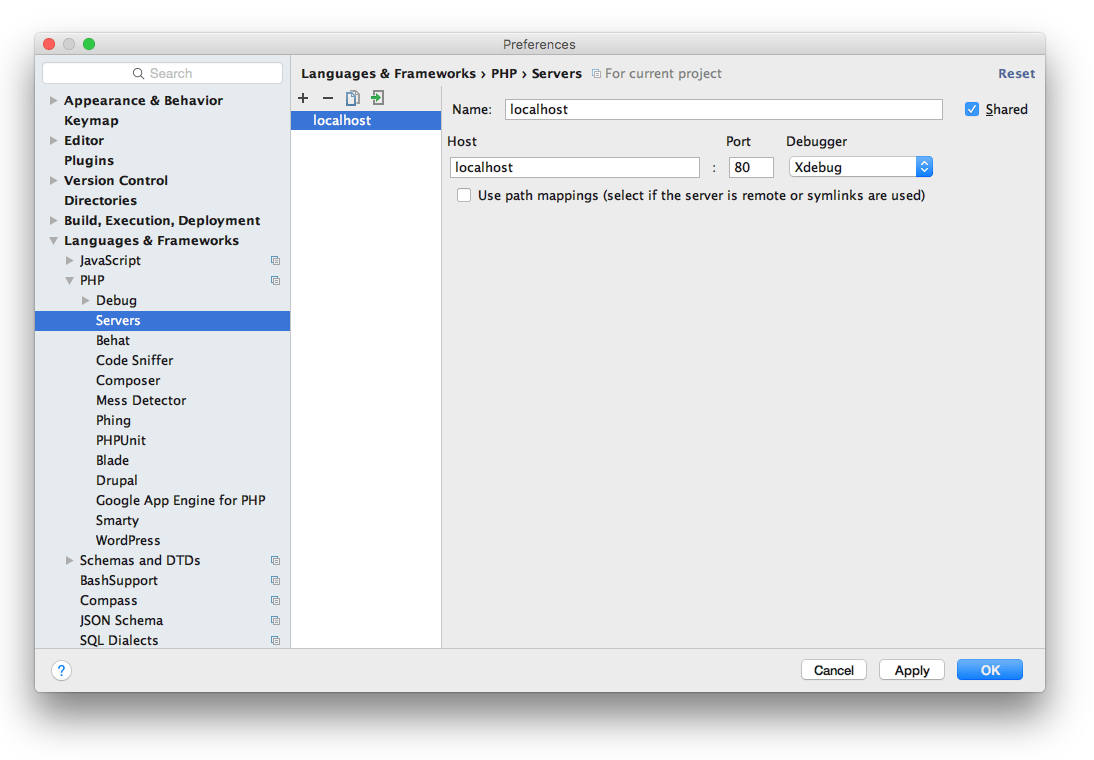
Preferences → Languages & Frameworks → PHP → Servers: Add new server with your onwn Name (localhost), Host (localhost), Port (80) and Debugger Xdebug settings
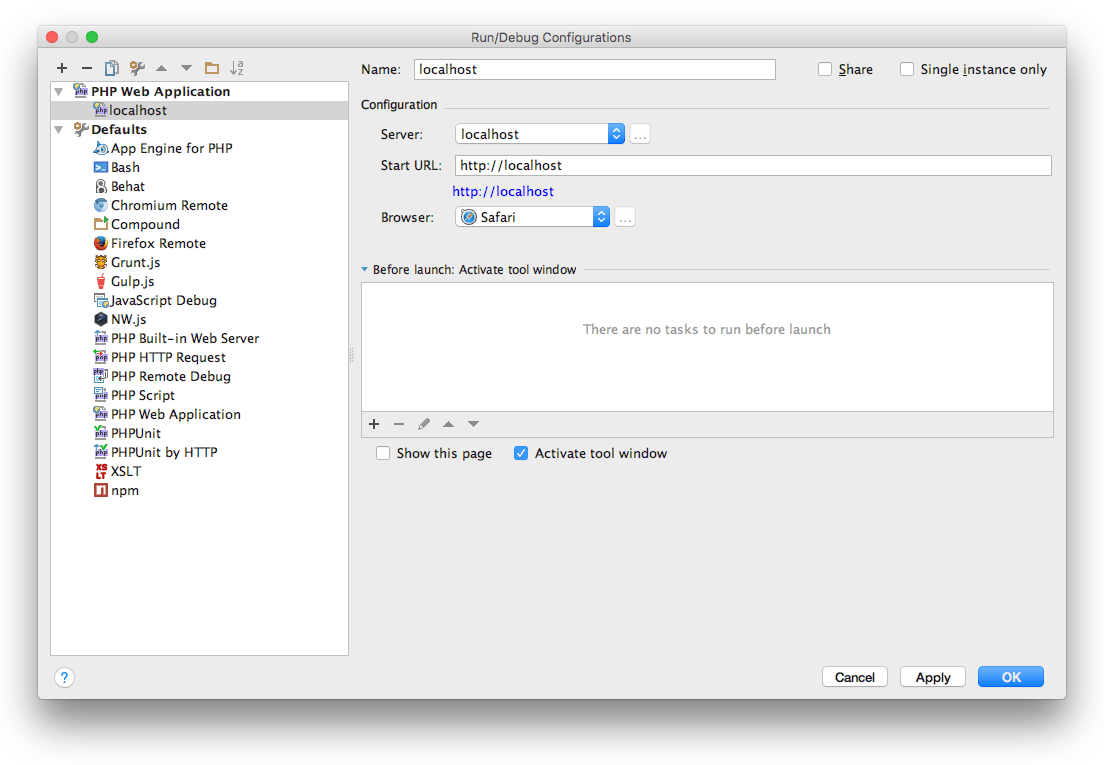
Click Edit Configurations... on PhpStorm upper right corner open Run/Debug Configurations box, setting Server, Start URL and Browser
Launch Debug Session
On PhpStorm from the menu: Run → Start Listening for PHP Debug Connections
Chrome Extension Xdebug helper
Firefox Add-ons The easiest Xdebug
Related Article
Profiling PHP Applications with XHProf
Profiling PHP Applications with Xdebug