Tabella pivot
Una tabella pivot è una tabella di statistiche che riepiloga i dati di una tabella più ampia (ad esempio da un database, un foglio di calcolo o un programma di business intelligence). Questo riepilogo potrebbe includere somme, medie o altre statistiche, che la tabella pivot raggruppa in modo significativo.
PivotTableOptions mappa direttamente le impostazioni di formato della tabella pivot.
type PivotTableOptions struct {
    DataRange           string
    PivotTableRange     string
    Name                string
    Rows                []PivotTableField
    Columns             []PivotTableField
    Data                []PivotTableField
    Filter              []PivotTableField
    RowGrandTotals      bool
    ColGrandTotals      bool
    ShowDrill           bool
    UseAutoFormatting   bool
    PageOverThenDown    bool
    MergeItem           bool
    ClassicLayout       bool
    CompactData         bool
    ShowError           bool
    ShowRowHeaders      bool
    ShowColHeaders      bool
    ShowRowStripes      bool
    ShowColStripes      bool
    ShowLastColumn      bool
    FieldPrintTitles    bool
    ItemPrintTitles     bool
    PivotTableStyleName string
    // contiene campi filtrati o non esportati
}
PivotTableStyleName: i nomi degli stili di tabella pivot integrati:
PivotStyleLight1 - PivotStyleLight28
PivotStyleMedium1 - PivotStyleMedium28
PivotStyleDark1 - PivotStyleDark28
PivotTableShowValuesAsType è il tipo di calcolo per la visualizzazione dei valori in una tabella pivot.
type PivotTableShowValuesAsType byte
PivotTableShowValuesAsType definisce l'enumerazione del tipo di calcolo.
const (
    PivotTableShowValuesAsNoCalculation PivotTableShowValuesAsType = iota
    PivotTableShowValuesAsPercentOfGrandTotal
    PivotTableShowValuesAsPercentOfColumnTotal
    PivotTableShowValuesAsPercentOfRowTotal
    PivotTableShowValuesAsPercentOf
    PivotTableShowValuesAsPercentOfParentRowTotal
    PivotTableShowValuesAsPercentOfParentColumnTotal
    PivotTableShowValuesAsPercentOfParentTotal
    PivotTableShowValuesAsDifferenceFrom
    PivotTableShowValuesAsPercentDifferenceFrom
    PivotTableShowValuesAsRunningTotalIn
    PivotTableShowValuesAsPercentRunningTotalIn
    PivotTableShowValuesAsRankSmallestToLargest
    PivotTableShowValuesAsRankLargestToSmallest
    PivotTableShowValuesAsIndex
)
PivotTableShowValuesAs associa direttamente le impostazioni di visualizzazione dei valori della tabella pivot.
type PivotTableShowValuesAs struct {
    Type      PivotTableShowValuesAsType
    BaseField string
    BaseItem  string
}
PivotTableField mappa direttamente le impostazioni del campo della tabella pivot.
type PivotTableField struct {
    Compact         bool
    Data            string
    Name            string
    Outline         bool
    ShowAll         bool
    InsertBlankRow  bool
    Subtotal        string
    DefaultSubtotal bool
    NumFmt          int
    SelectedItems   []string
    ShowValuesAs    PivotTableShowValuesAs
}
Subtotal specifica la funzione di aggregazione che si applica a questo campo dati. Il valore predefinito è Sum. I possibili valori per questo attributo sono:
| Valore facoltativo |
|---|
| Average |
| Count |
| CountNums |
| Max |
| Min |
| Product |
| StdDev |
| StdDevp |
| Sum |
| Var |
| Varp |
Name specifica il nome del campo dati. Nel nome del campo dati sono consentiti al massimo 255 caratteri, i caratteri in eccesso verranno troncati.
SelectedItems specifica gli elementi selezionati di default in un campo di una tabella pivot. Gli elementi selezionati devono essere valori compresi nell'intervallo di celle a cui fa riferimento tale campo.
ShowValuesAs specifica il tipo di calcolo per la visualizzazione dei valori nei campi dei valori di una tabella pivot. I valori possibili per il campo Type di ShowValuesAs sono:
| Valore opzionale |
|---|
| PivotTableShowValuesAsPercentOfGrandTotal |
| PivotTableShowValuesAsPercentOfColumnTotal |
| PivotTableShowValuesAsPercentOfRowTotal |
| PivotTableShowValuesAsPercentOf |
| PivotTableShowValuesAsPercentOfParentRowTotal |
| PivotTableShowValuesAsPercentOfParentColumnTotal |
| PivotTableShowValuesAsPercentOfParentTotal |
| PivotTableShowValuesAsDifferenceFrom |
| PivotTableShowValuesAsPercentDifferenceFrom |
| PivotTableShowValuesAsRunningTotalIn |
| PivotTableShowValuesAsPercentRunningTotalIn |
| PivotTableShowValuesAsRankSmallestToLargest |
| PivotTableShowValuesAsRankLargestToSmallest |
| PivotTableShowValuesAsIndex |
Si noti che le impostazioni del campo base e dell'elemento base di ShowValuesAs sono richieste solo per alcuni tipi di calcolo. I tipi di calcolo che richiedono le impostazioni del campo base sono:
| Tipi di calcolo |
|---|
| PivotTableShowValuesAsPercentOf |
| PivotTableShowValuesAsPercentOfParentTotal |
| PivotTableShowValuesAsDifferenceFrom |
| PivotTableShowValuesAsPercentDifferenceFrom |
| PivotTableShowValuesAsRunningTotalIn |
| PivotTableShowValuesAsPercentRunningTotalIn |
| PivotTableShowValuesAsRankSmallestToLargest |
| PivotTableShowValuesAsRankLargestToSmallest |
I tipi di calcolo supportati che richiedono le impostazioni dell'elemento base sono:
| Tipi di calcolo |
|---|
| PivotTableShowValuesAsPercentOf |
| PivotTableShowValuesAsDifferenceFrom |
| PivotTableShowValuesAsPercentDifferenceFrom |
Crea tabella pivot
func (f *File) AddPivotTable(opts *PivotTableOptions) error
AddPivotTable fornisce il metodo per aggiungere una tabella pivot in base alle opzioni della tabella pivot.
Ad esempio, crea una tabella pivot nell'area Foglio1!G4:M30 con la regione Foglio1!$A1:E31 come origine dati, riepiloga per somma per le vendite:
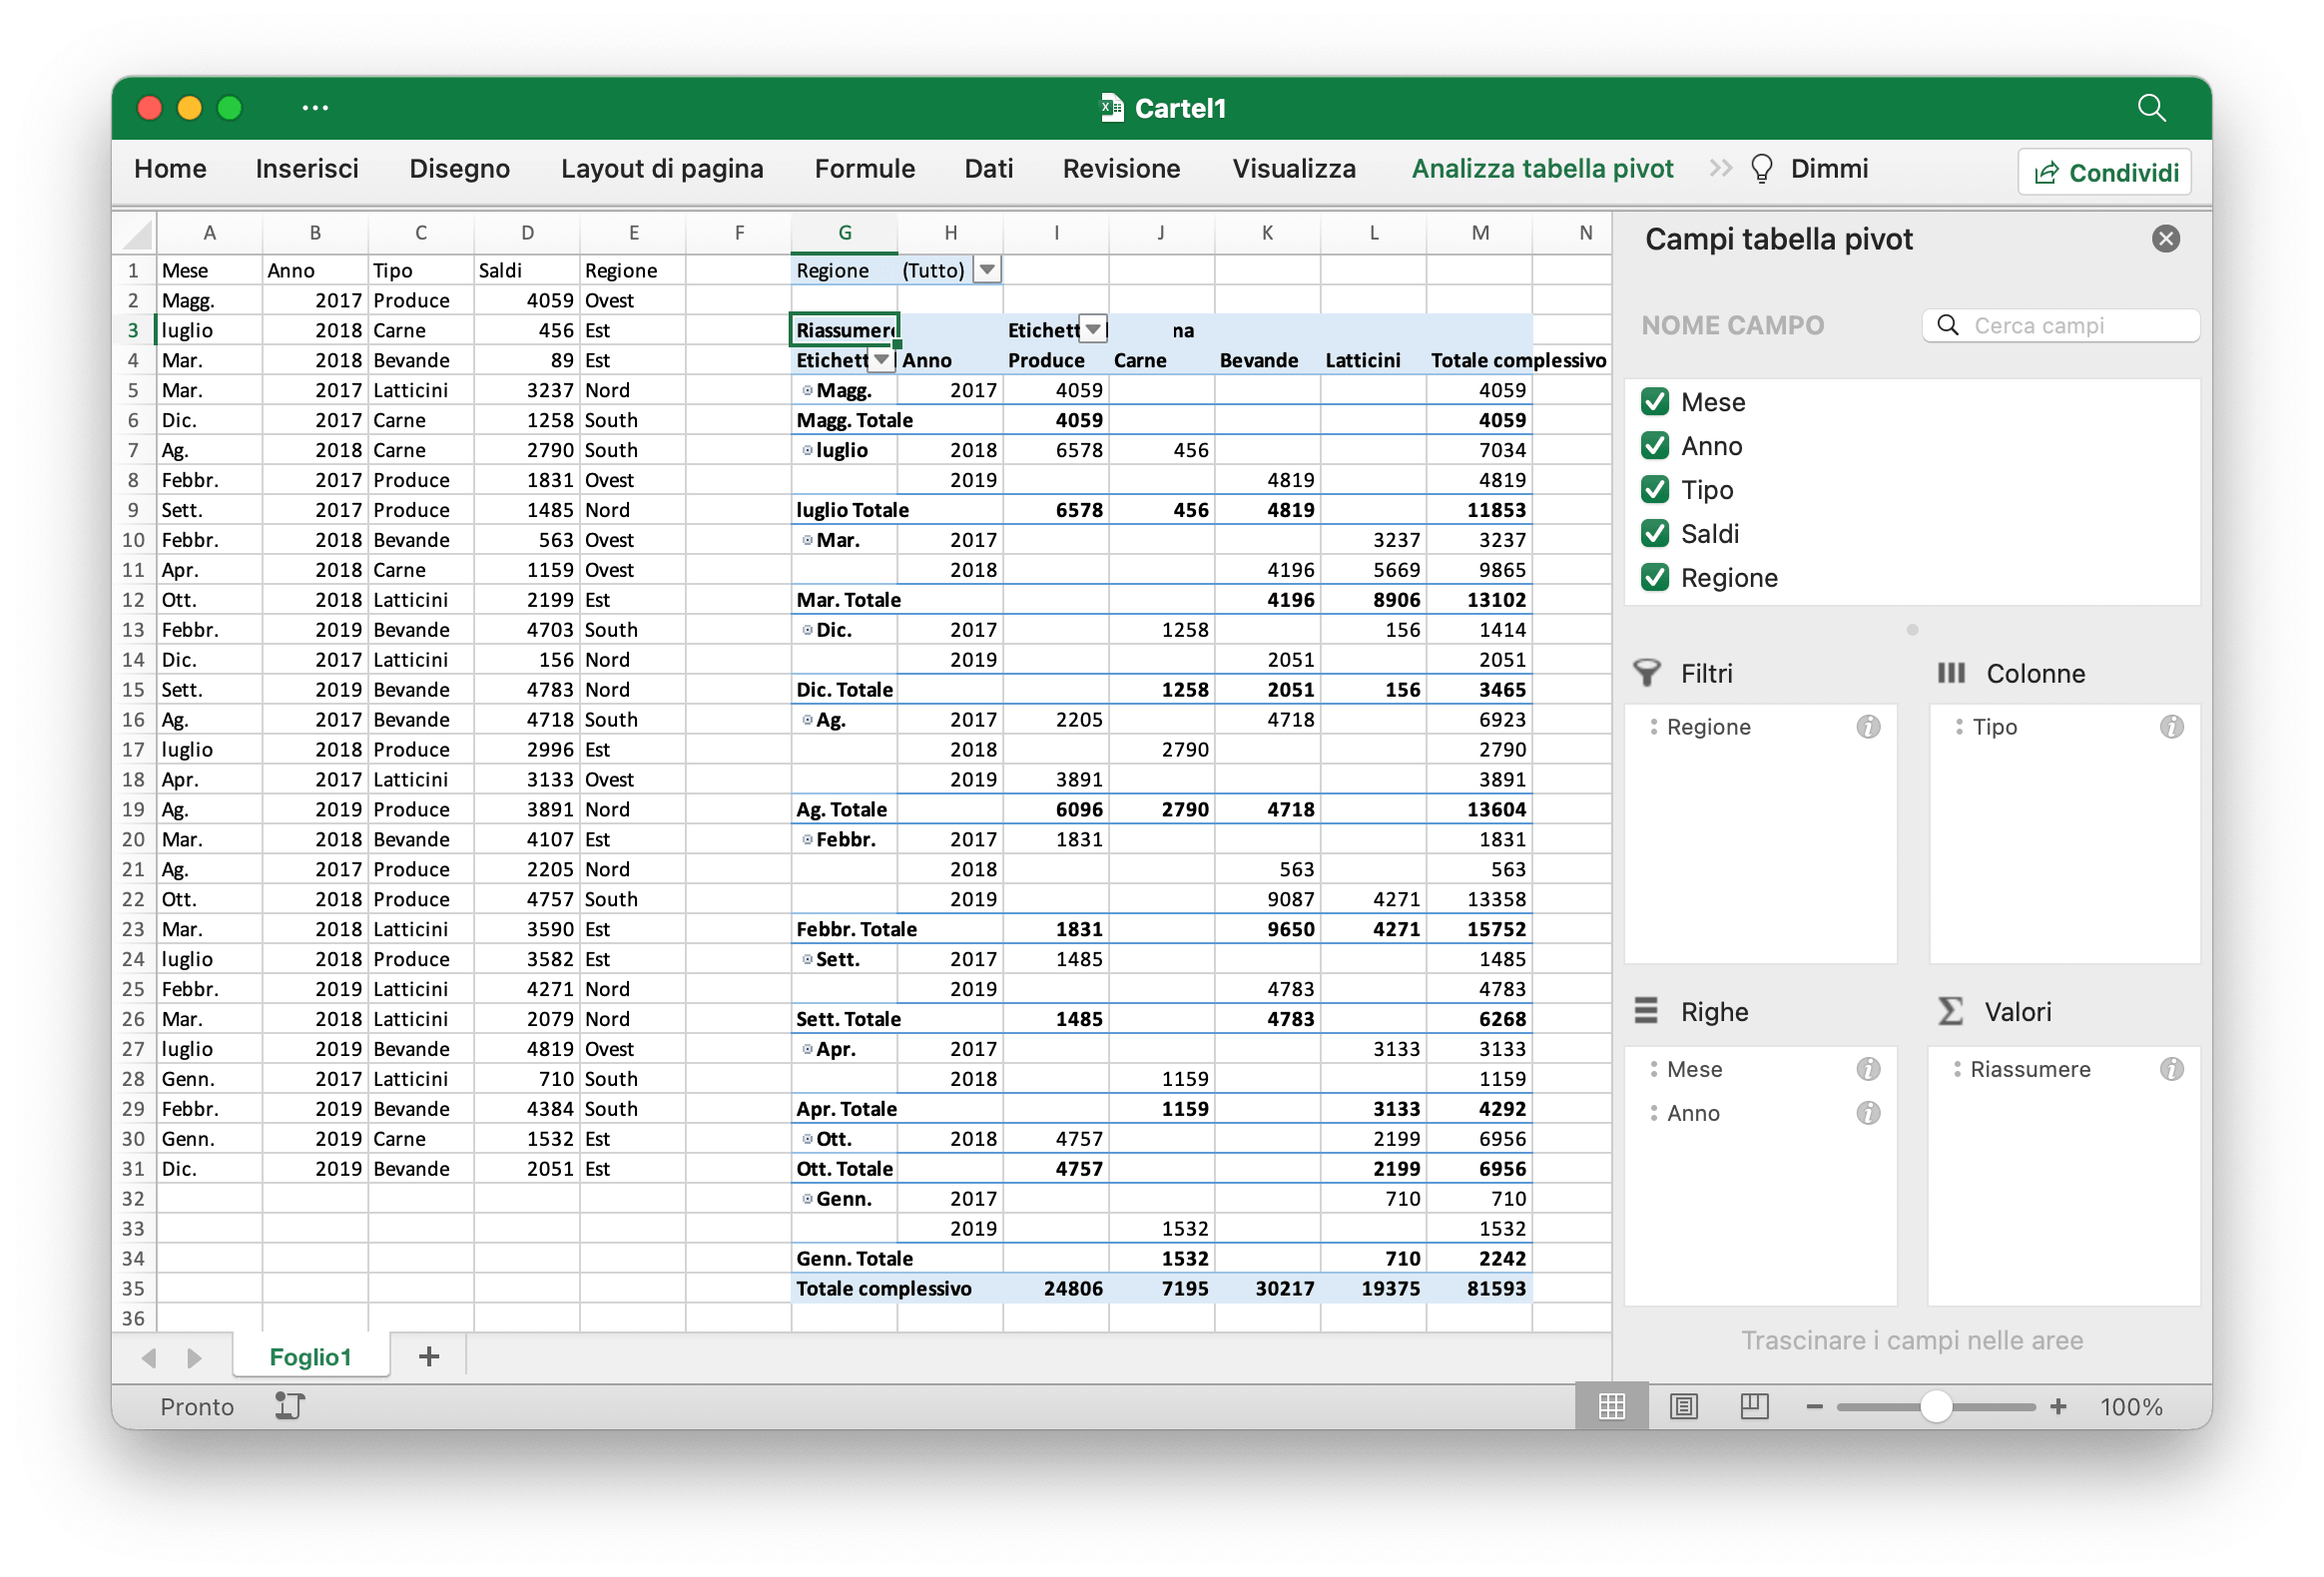
package main

import (
    "fmt"

    "github.com/xuri/excelize/v2"
)

func main() {
    f := excelize.NewFile()
    defer func() {
        if err := f.Close(); err != nil {
            fmt.Println(err)
        }
    }()
    if err := f.SetSheetName("Sheet1", "Foglio1"); err != nil {
        fmt.Println(err)
        return
    }
    // Creare alcuni dati in un foglio
    month := []string{"Genn.", "Febbr.", "Mar.", "Apr.", "Magg.",
        "Giugno", "luglio", "Ag.", "Sett.", "Ott.", "Nov.", "Dic."}
    year := []int{2017, 2018, 2019}
    types := []string{"Carne", "Latticini", "Bevande", "Produrre"}
    revenue := []int{3217, 4512, 3891, 4738, 3054, 4265, 3643, 4901, 3378, 4126}
    region := []string{"Est", "Ovest", "Nord", "Sud"}
    if err := f.SetSheetRow(
        "Foglio1", "A1", &[]string{"Mese", "Anno", "Tipo", "Entrate", "Regione"},
    ); err != nil {
        fmt.Println(err)
        return
    }
    for row := 2; row < 32; row++ {
        f.SetCellValue("Foglio1", fmt.Sprintf("A%d", row), month[(row-2)%len(month)])
        f.SetCellValue("Foglio1", fmt.Sprintf("B%d", row), year[(row-2)%len(year)])
        f.SetCellValue("Foglio1", fmt.Sprintf("C%d", row), types[(row-2)%len(types)])
        f.SetCellValue("Foglio1", fmt.Sprintf("D%d", row), revenue[(row-2)%len(revenue)])
        f.SetCellValue("Foglio1", fmt.Sprintf("E%d", row), region[(row-2)%len(region)])
    }
    if err := f.AddPivotTable(&excelize.PivotTableOptions{
        DataRange:       "Foglio1!A1:E31",
        PivotTableRange: "Foglio1!G4:M30",
        Rows: []excelize.PivotTableField{
            {Data: "Mese", DefaultSubtotal: true}, {Data: "Anno"},
        },
        Filter: []excelize.PivotTableField{
            {Data: "Regione"},
        },
        Columns: []excelize.PivotTableField{
            {Data: "Tipo", DefaultSubtotal: true},
        },
        Data: []excelize.PivotTableField{
            {Data: "Entrate", Name: "Riassumere", Subtotal: "Sum"},
        },
        RowGrandTotals: true,
        ColGrandTotals: true,
        ShowDrill:      true,
        ShowRowHeaders: true,
        ShowColHeaders: true,
        ShowLastColumn: true,
    }); err != nil {
        fmt.Println(err)
        return
    }
    if err := f.SaveAs("Cartel1.xlsx"); err != nil {
        fmt.Println(err)
    }
}
Ottieni tabelle pivot
func (f *File) GetPivotTables(sheet string) ([]PivotTableOptions, error)
GetPivotTables restituisce tutte le definizioni di tabella pivot in un foglio di lavoro in base al nome del foglio di lavoro specificato.
Elimina la tabella pivot
func (f *File) DeletePivotTable(sheet, name string) error
DeletePivotTable elimina una tabella pivot fornendo il nome del foglio di lavoro e il nome della tabella pivot. Tieni presente che questa funzione non pulisce i valori delle celle nell'intervallo della tabella pivot.