Basic Usage
Installation
The following table shows the minimum requirements of Python language with each Excelize released version:
| Excelize Version | Minimum Python Language Version Requirements |
|---|---|
| v0.0.4 ~ master | 3.9 |
| v0.0.3 | 3.9 |
| v0.0.2 | 3.7 |
- Installation
pip install excelize
Upgrade
- Upgrade to latest released stable version
pip install excelize --upgrade
Create Excel document
Here is a minimal example usage that will create spreadsheet file:
import excelize

f = excelize.new_file()
try:
    # Create a new sheet.
    index = f.new_sheet("Sheet2")
    # Set value of a cell.
    f.set_cell_value("Sheet2", "A2", "Hello world.")
    f.set_cell_value("Sheet1", "B2", 100)
    # Set active sheet of the workbook.
    f.set_active_sheet(index)
    # Save spreadsheet by the given path.
    f.save_as("Book1.xlsx")
except (RuntimeError, TypeError) as err:
    print(err)
finally:
    err = f.close()
    if err:
        print(err)
Reading Excel document
The following constitutes the bare to read a spreadsheet document:
import excelize

try:
    f = excelize.open_file("Book1.xlsx")
except (RuntimeError, TypeError) as err:
    print(err)
    exit()
try:
    # Get value from cell by given worksheet name and cell reference.
    cell = f.get_cell_value("Sheet1", "B2")
    print(cell)
    # Get all the rows in the Sheet1.
    rows = f.get_rows("Sheet1")
    for row in rows:
        for cell in row:
            print(f"{cell}\t", end="")
        print()
except (RuntimeError, TypeError) as err:
    print(err)
finally:
    # Close the spreadsheet.
    err = f.close()
    if err:
        print(err)
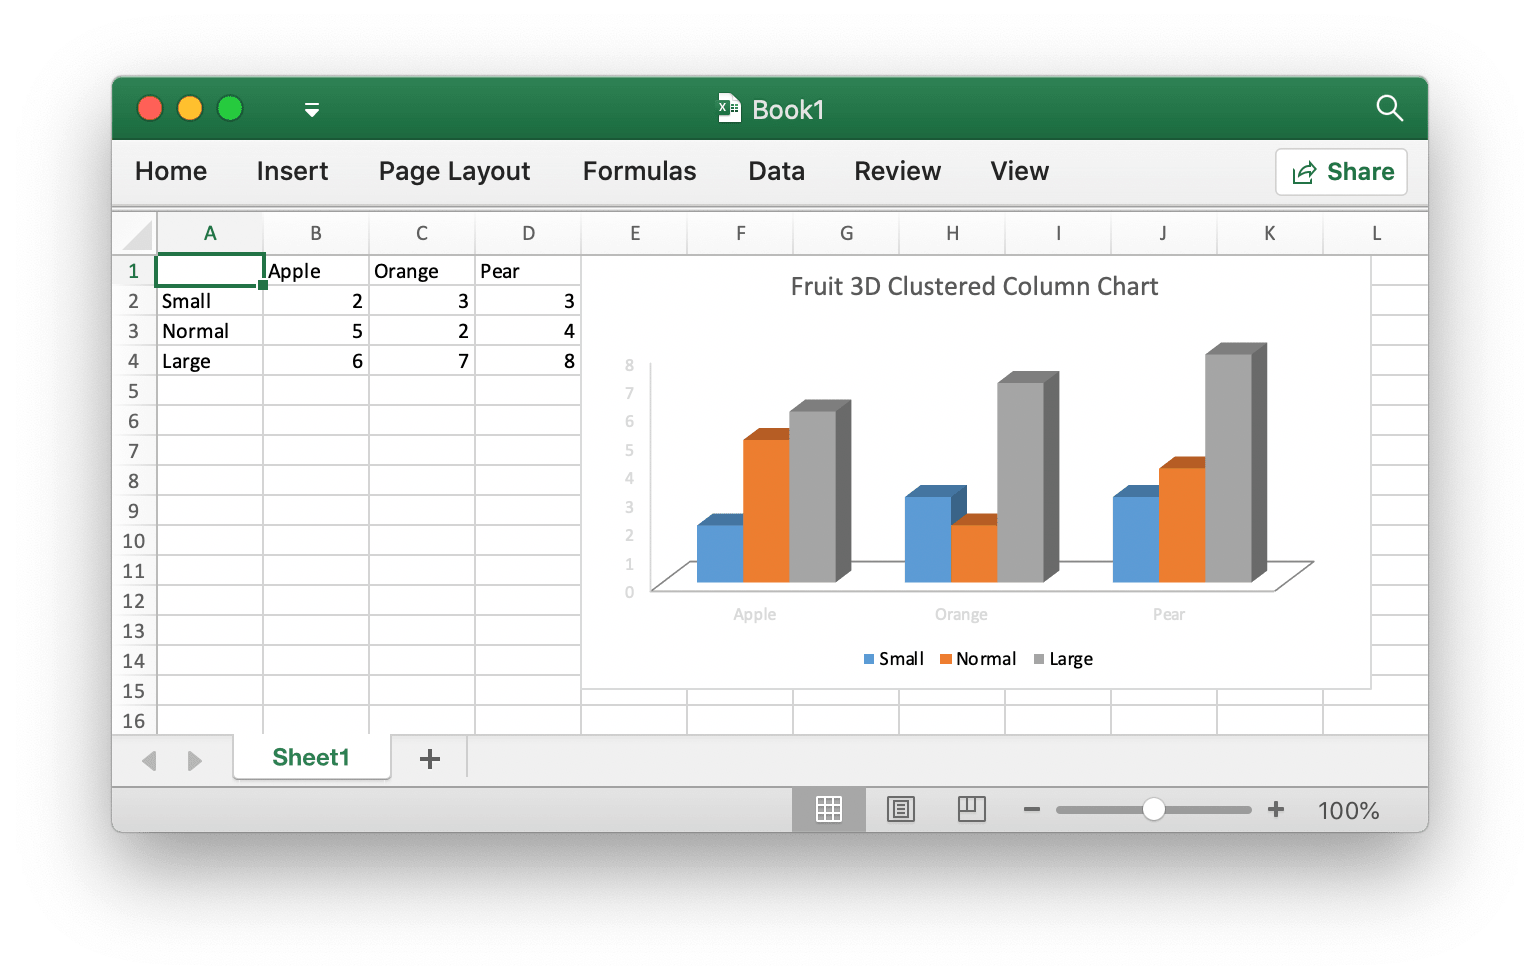
Add chart to Excel document
With Excelize chart generation and management is as easy as a few lines of code. You can build charts based on data in your worksheet or generate charts without any data in your worksheet at all.
import excelize

f = excelize.new_file()
data = [
    [None, "Apple", "Orange", "Pear"],
    ["Small", 2, 3, 3],
    ["Normal", 5, 2, 4],
    ["Large", 6, 7, 8],
]
try:
    for idx, row in enumerate(data):
        cell = excelize.coordinates_to_cell_name(1, idx + 1, False)
        f.set_sheet_row("Sheet1", cell, row)
    chart = excelize.Chart(
        type=excelize.ChartType.Col3DClustered,
        series=[
            excelize.ChartSeries(
                name="Sheet1!$A$2",
                categories="Sheet1!$B$1:$D$1",
                values="Sheet1!$B$2:$D$2",
            ),
            excelize.ChartSeries(
                name="Sheet1!$A$3",
                categories="Sheet1!$B$1:$D$1",
                values="Sheet1!$B$3:$D$3",
            ),
            excelize.ChartSeries(
                name="Sheet1!$A$4",
                categories="Sheet1!$B$1:$D$1",
                values="Sheet1!$B$4:$D$4",
            ),
        ],
        title=[excelize.RichTextRun(text="Fruit 3D Clustered Column Chart")],
    )
    f.add_chart("Sheet1", "E1", chart)
    # Save spreadsheet by the given path.
    f.save_as("Book1.xlsx")
except (RuntimeError, TypeError) as err:
    print(err)
finally:
    err = f.close()
    if err:
        print(err)
Add picture to Excel document
import excelize

try:
    f = excelize.open_file("Book1.xlsx")
except (RuntimeError, TypeError) as err:
    print(err)
    exit()
try:
    # Insert a picture.
    f.add_picture("Sheet1", "A2", "image.png", None)
    # Insert a picture to worksheet with scaling.
    f.add_picture("Sheet1", "D2", "image.jpg", excelize.GraphicOptions(
        scale_x=0.5,
        scale_y=0.5,
    ))
    # Insert a picture offset in the cell with printing support.
    f.add_picture("Sheet1", "H2", "image.gif", excelize.GraphicOptions(
        print_object=True,
        lock_aspect_ratio=False,
        offset_x=15,
        offset_y=10,
        locked=False,
    ))
    # Save the spreadsheet with the origin path.
    f.save()
except (RuntimeError, TypeError) as err:
    print(err)
finally:
    # Close the spreadsheet.
    err = f.close()
    if err:
        print(err)