Pivot Table
A pivot table is a table of statistics that summarizes the data of a more extensive table (such as from a database, spreadsheet, or business intelligence program). This summary might include sums, averages, or other statistics, which the pivot table groups together in a meaningful way.
PivotTableOptions directly maps the format settings of the pivot table.
class PivotTableOptions:
    data_range: str = ""
    pivot_table_range: str = ""
    name: str = ""
    rows: Optional[List[PivotTableField]] = None
    columns: Optional[List[PivotTableField]] = None
    data: Optional[List[PivotTableField]] = None
    filter: Optional[List[PivotTableField]] = None
    row_grand_totals: bool = False
    col_grand_totals: bool = False
    show_drill: bool = False
    use_auto_formatting: bool = False
    page_over_then_down: bool = False
    merge_item: bool = False
    classic_layout: bool = False
    compact_data: bool = False
    show_error: bool = False
    show_row_headers: bool = False
    show_col_headers: bool = False
    show_row_stripes: bool = False
    show_col_stripes: bool = False
    show_last_column: bool = False
    field_print_titles: bool = False
    item_print_titles: bool = False
    pivot_table_style_name: str = ""
pivot_table_style_name: The built-in pivot table style names:
PivotStyleLight1 - PivotStyleLight28
PivotStyleMedium1 - PivotStyleMedium28
PivotStyleDark1 - PivotStyleDark28
PivotTableField directly maps the field settings of the pivot table.
class PivotTableField:
    compact: bool = False
    data: str = ""
    name: str = ""
    outline: bool = False
    show_all: bool = False
    insert_blank_row: bool = False
    subtotal: str = ""
    default_subtotal: bool = False
    num_fmt: int = 0
subtotal specifies the aggregation function that applies to this data field. The default value is Sum. The possible values for this attribute are:
| Optional Value |
|---|
| Average |
| Count |
| CountNums |
| Max |
| Min |
| Product |
| StdDev |
| StdDevp |
| Sum |
| Var |
| Varp |
name specifies the name of the data field. Maximum 255 characters are allowed in data field name, excess characters will be truncated.
Create pivot table
def add_pivot_table(self, opts: Optional[PivotTableOptions]) -> None
Add pivot table by given pivot table options.
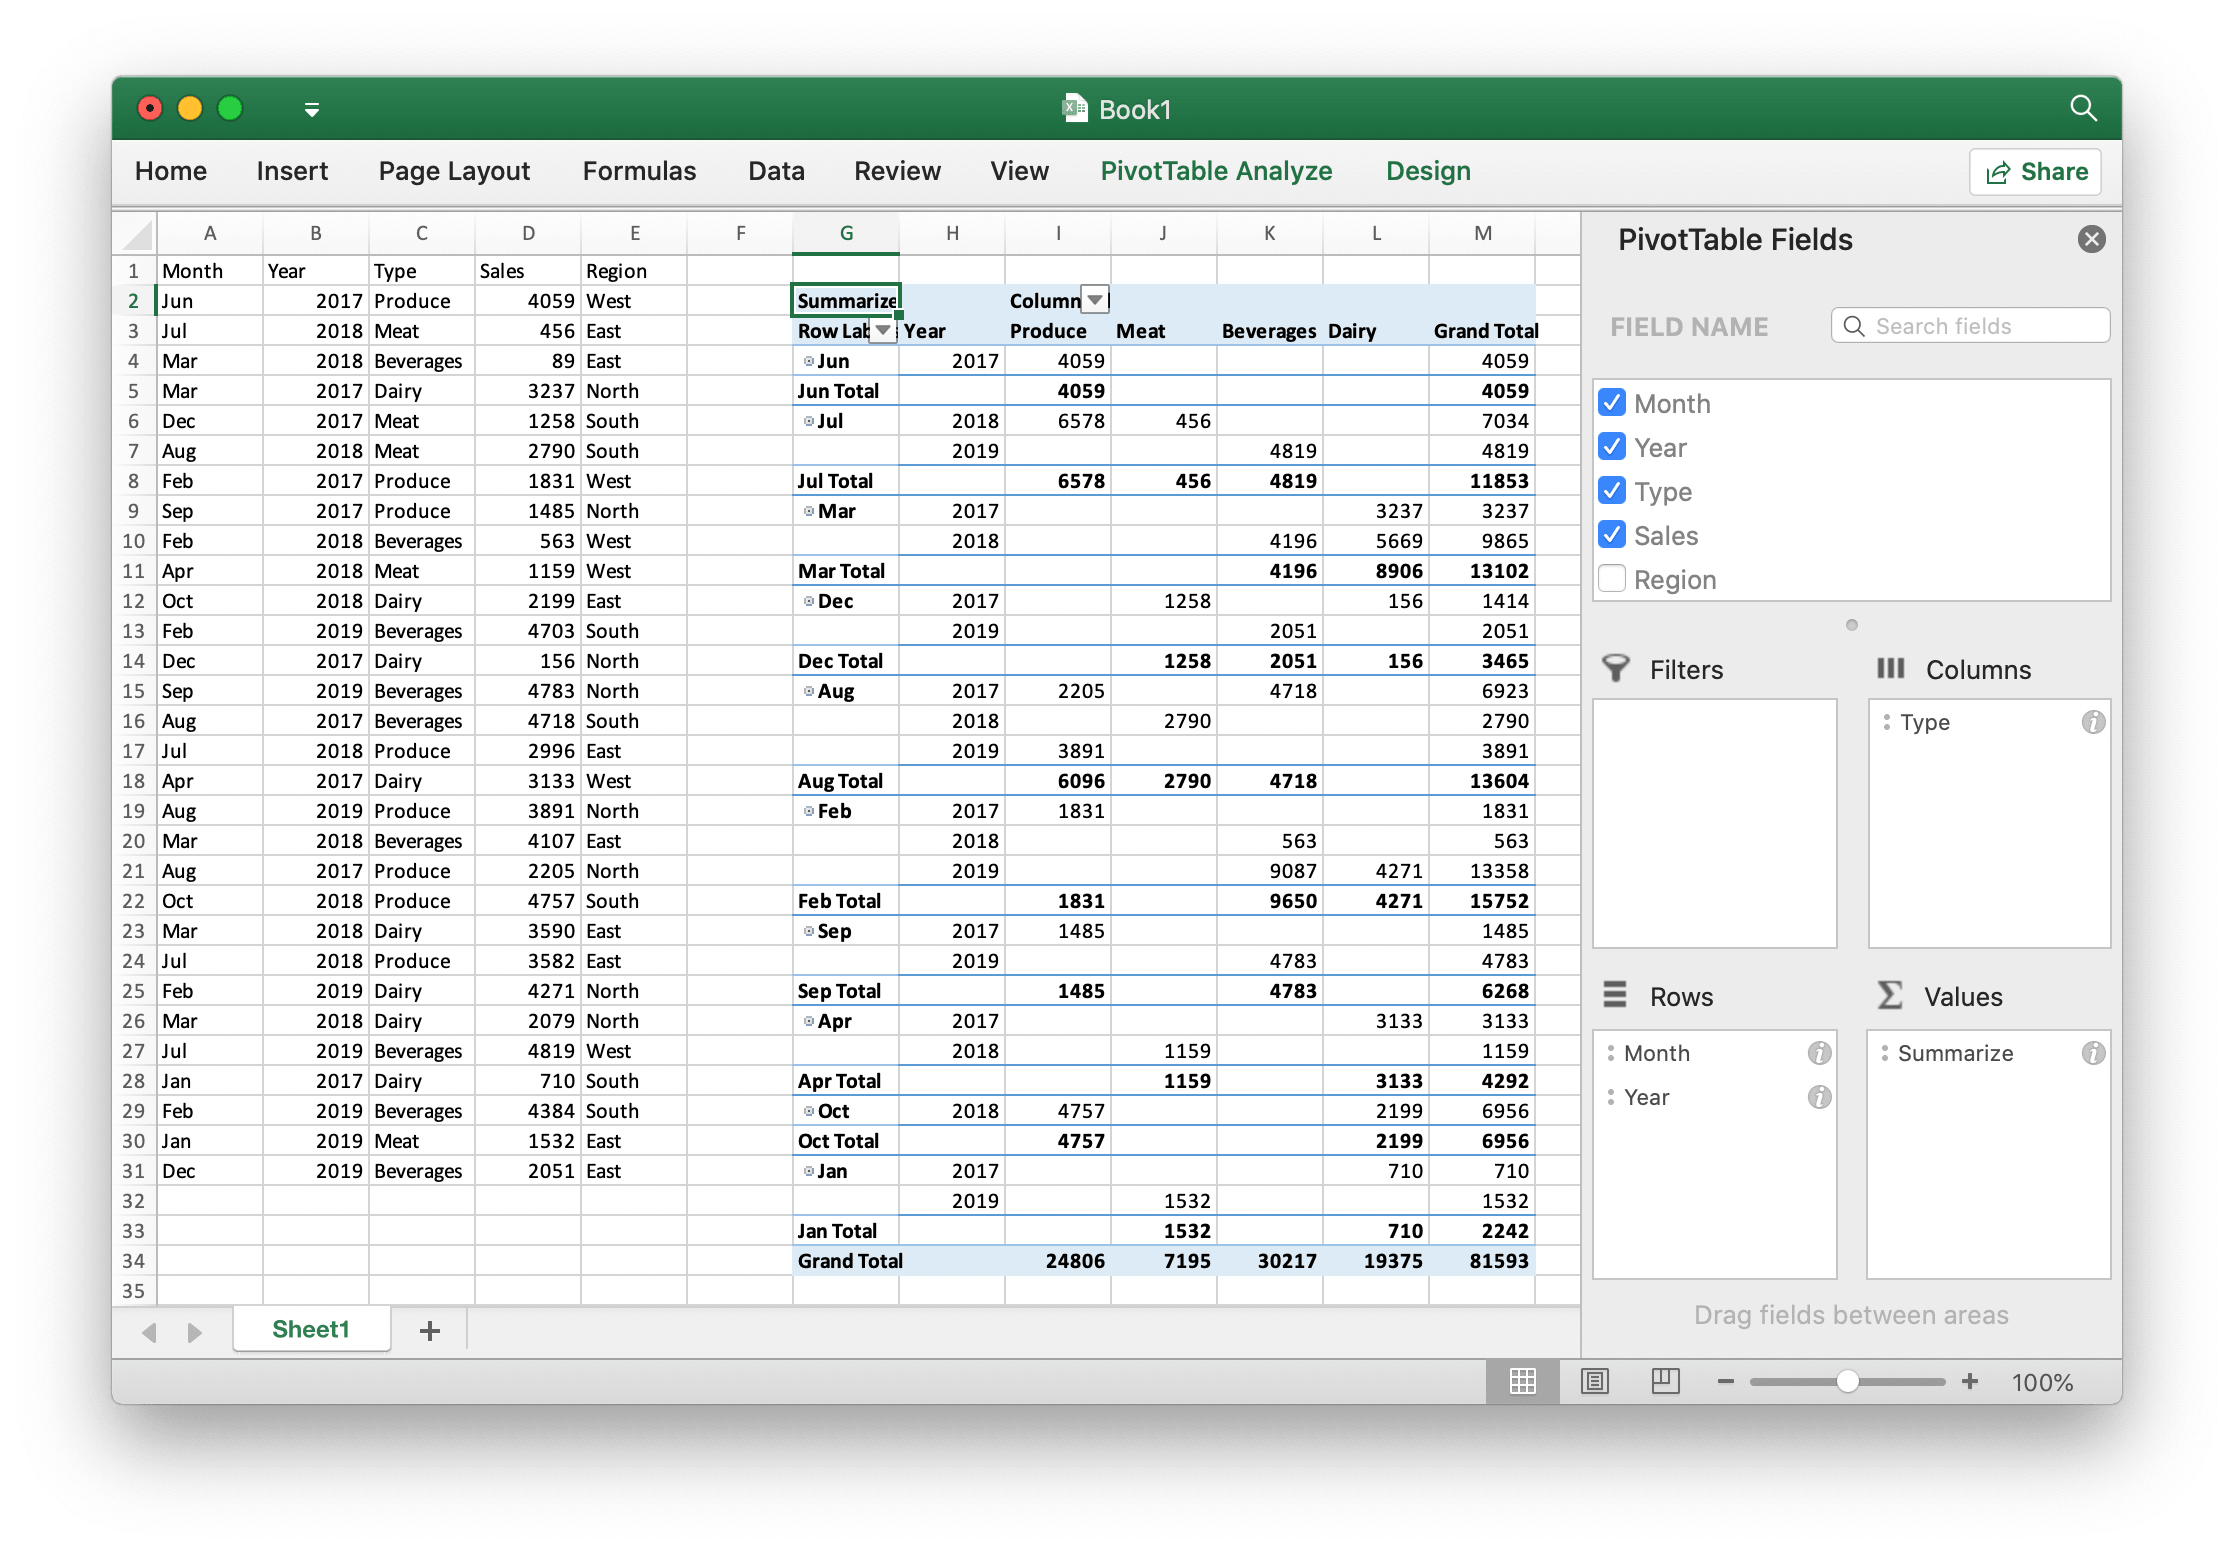
For example, create a pivot table on the Sheet1!$G$2:$M$34 area with the region Sheet1!$A$1:$E$31 as the data source, summarize by sum for sales:
import excelize
import random

f = excelize.new_file()
month = [
    "Jan", "Feb", "Mar", "Apr", "May", "Jun",
    "Jul", "Aug", "Sep", "Oct", "Nov", "Dec",
]
year = [2017, 2018, 2019]
types = ["Meat", "Dairy", "Beverages", "Produce"]
region = ["East", "West", "North", "South"]
try:
    f.set_sheet_row("Sheet1", "A1", ["Month", "Year", "Type", "Sales", "Region"])
    for row in range(2, 32):
        f.set_cell_value("Sheet1", f"A{row}", month[random.randrange(12)])
        f.set_cell_value("Sheet1", f"B{row}", year[random.randrange(3)])
        f.set_cell_value("Sheet1", f"C{row}", types[random.randrange(4)])
        f.set_cell_value("Sheet1", f"D{row}", random.randrange(5000))
        f.set_cell_value("Sheet1", f"E{row}", region[random.randrange(4)])

    f.add_pivot_table(
        excelize.PivotTableOptions(
            data_range="Sheet1!A1:E31",
            pivot_table_range="Sheet1!G2:M34",
            rows=[
                excelize.PivotTableField(data="Month", default_subtotal=True),
                excelize.PivotTableField(data="Year"),
            ],
            filter=[excelize.PivotTableField(data="Region")],
            columns=[
                excelize.PivotTableField(data="Type", default_subtotal=True),
            ],
            data=[
                excelize.PivotTableField(
                    data="Sales", name="Summarize", subtotal="Sum",
                )
            ],
            row_grand_totals=True,
            col_grand_totals=True,
            show_drill=True,
            show_row_headers=True,
            show_col_headers=True,
            show_last_column=True,
        )
    )
    f.save_as("Book1.xlsx")
except (RuntimeError, TypeError) as err:
    print(err)
finally:
    err = f.close()
    if err:
        print(err)