Sparklines
Sparklines are a feature of Excel 2010+ which allows you to add small charts to worksheet cells. These are useful for showing visual trends in data in a compact format.
Sparklines was invented by Edward Tufte.
Add Sparkline
def add_sparkline(sheet: str, opts: SparklineOptions) -> None
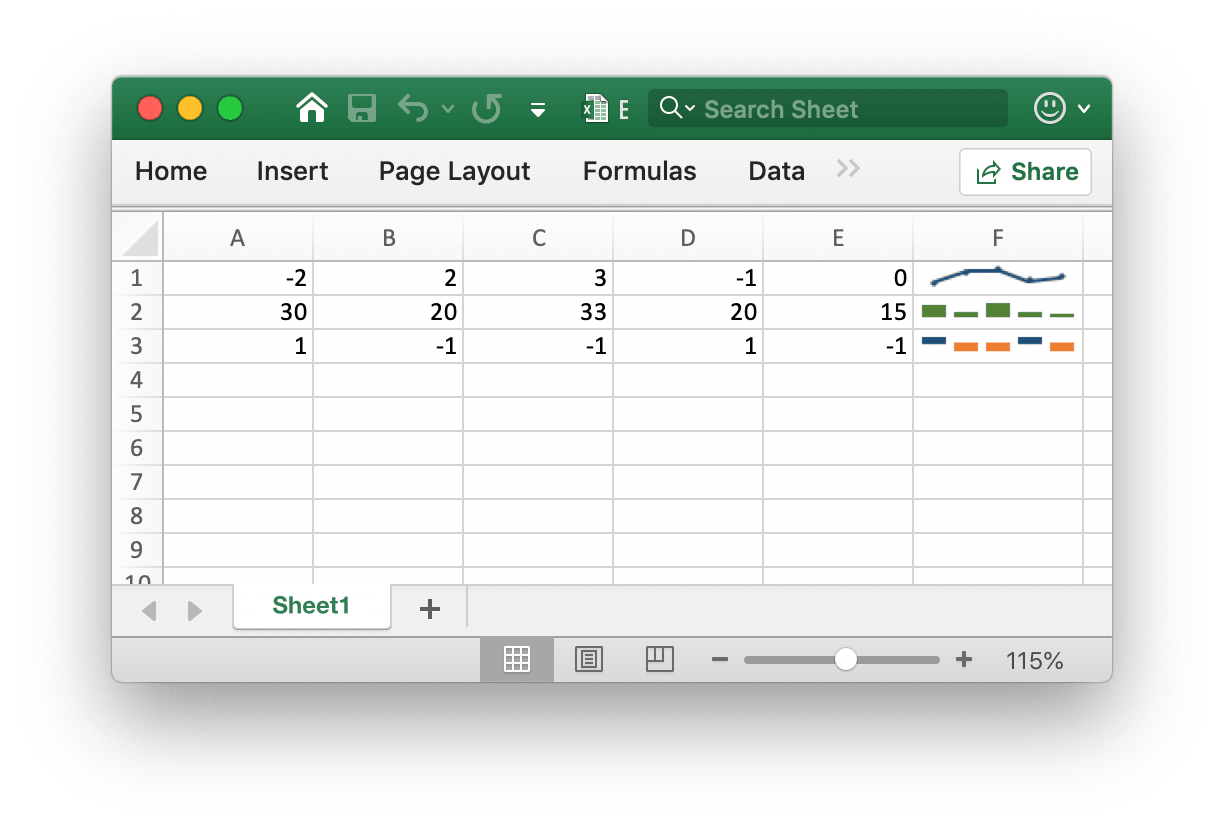
Add sparklines to the worksheet by given formatting options. Sparklines are small charts that fit in a single cell and are used to show trends in data. Sparklines are a feature of Excel 2010 and later only. You can write them to a spreadsheet file that can be read by Excel 2007 but they won't be displayed. For example, add a grouped sparkline. Changes are applied to all three:
try:
    f.add_sparkline(
        "Sheet1",
        excelize.SparklineOptions(
            location=["A1", "A2", "A3"],
            range=["Sheet2!A1:J1", "Sheet2!A2:J2", "Sheet2!A3:J3"],
            markers=True,
        ),
    )
except (RuntimeError, TypeError) as err:
    print(err)
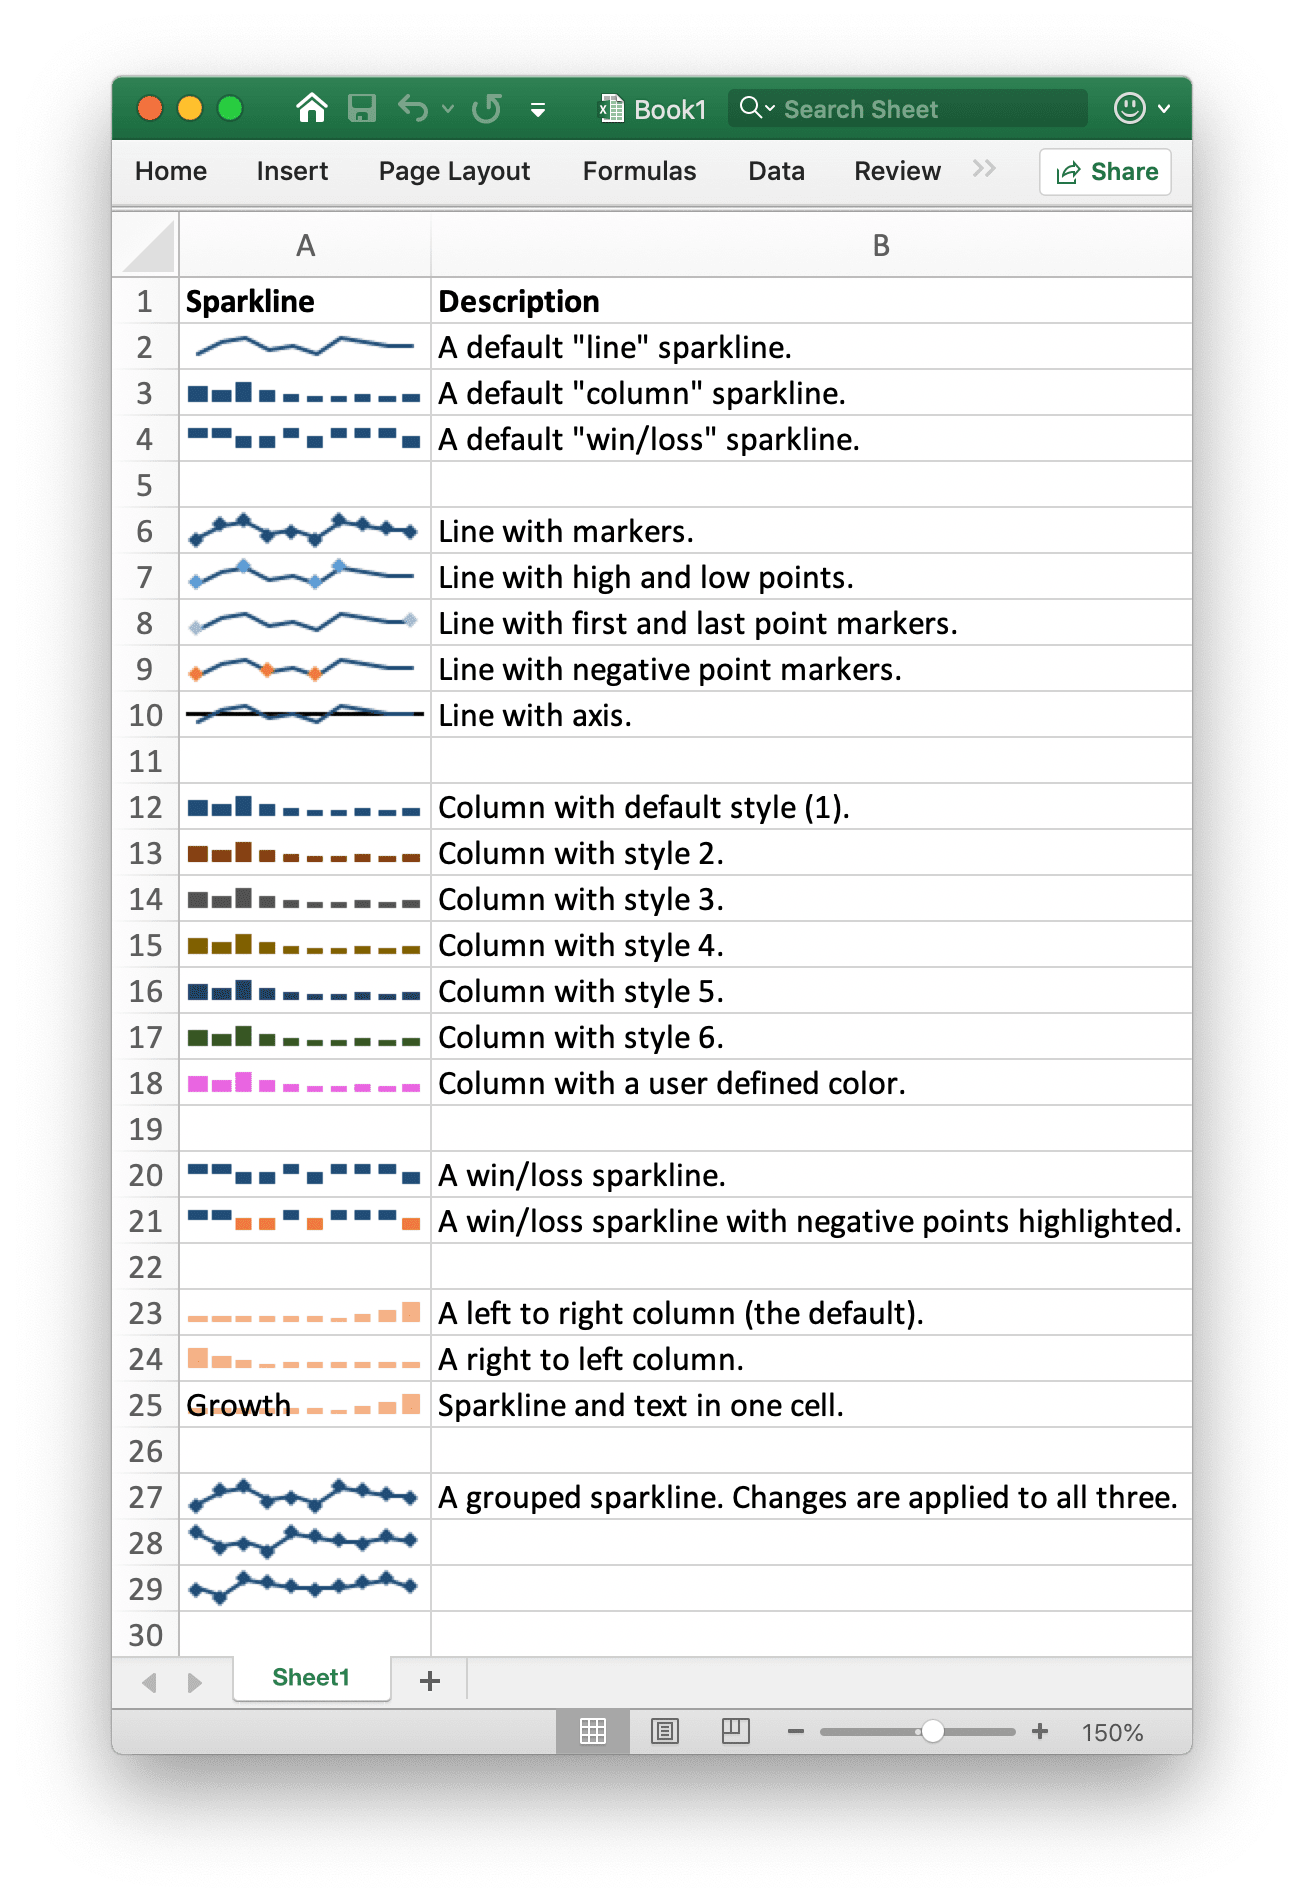
The following shows the formatting options of sparkline supported by excelize:
| Parameter | Description |
|---|---|
| Location | Required, must have the same number with range parameter |
| Range | Required, must have the same number with location parameter |
| Type | Enumeration value: line, column, win_loss |
| Style | Value range: 0 - 35 |
| Hight | Toggle sparkline high points |
| Low | Toggle sparkline low points |
| First | Toggle sparkline first points |
| Last | Toggle sparkline last points |
| Negative | Toggle sparkline negative points |
| Markers | Toggle sparkline markers |
| Axis | Used to specify if show horizontal axis |
| Reverse | Used to specify if enable plot data right-to-left |
| SeriesColor | An RGB Color is specified as RRGGBB |