Pivot Table
A pivot table is a table of statistics that summarizes the data of a more extensive table (such as from a database, spreadsheet, or business intelligence program). This summary might include sums, averages, or other statistics, which the pivot table groups together in a meaningful way.
PivotTableOptions directly maps the format settings of the pivot table.
type PivotTableOptions struct {
    DataRange           string
    PivotTableRange     string
    Name                string
    Rows                []PivotTableField
    Columns             []PivotTableField
    Data                []PivotTableField
    Filter              []PivotTableField
    RowGrandTotals      bool
    ColGrandTotals      bool
    ShowDrill           bool
    UseAutoFormatting   bool
    PageOverThenDown    bool
    MergeItem           bool
    ClassicLayout       bool
    CompactData         bool
    ShowError           bool
    ShowRowHeaders      bool
    ShowColHeaders      bool
    ShowRowStripes      bool
    ShowColStripes      bool
    ShowLastColumn      bool
    FieldPrintTitles    bool
    ItemPrintTitles     bool
    PivotTableStyleName string
    // contains filtered or unexported fields
}
PivotTableStyleName: The built-in pivot table style names:
PivotStyleLight1 - PivotStyleLight28
PivotStyleMedium1 - PivotStyleMedium28
PivotStyleDark1 - PivotStyleDark28
PivotTableShowValuesAsType is the type of calculation for showing values in a pivot table.
type PivotTableShowValuesAsType byte
PivotTableShowValuesAsType defines the calculation type enumeration.
const (
    PivotTableShowValuesAsNoCalculation PivotTableShowValuesAsType = iota
    PivotTableShowValuesAsPercentOfGrandTotal
    PivotTableShowValuesAsPercentOfColumnTotal
    PivotTableShowValuesAsPercentOfRowTotal
    PivotTableShowValuesAsPercentOf
    PivotTableShowValuesAsPercentOfParentRowTotal
    PivotTableShowValuesAsPercentOfParentColumnTotal
    PivotTableShowValuesAsPercentOfParentTotal
    PivotTableShowValuesAsDifferenceFrom
    PivotTableShowValuesAsPercentDifferenceFrom
    PivotTableShowValuesAsRunningTotalIn
    PivotTableShowValuesAsPercentRunningTotalIn
    PivotTableShowValuesAsRankSmallestToLargest
    PivotTableShowValuesAsRankLargestToSmallest
    PivotTableShowValuesAsIndex
)
PivotTableShowValuesAs directly maps the show value as settings of the pivot table.
type PivotTableShowValuesAs struct {
    Type      PivotTableShowValuesAsType
    BaseField string
    BaseItem  string
}
PivotTableField directly maps the field settings of the pivot table.
type PivotTableField struct {
    Compact         bool
    Data            string
    Name            string
    Outline         bool
    ShowAll         bool
    InsertBlankRow  bool
    Subtotal        string
    DefaultSubtotal bool
    NumFmt          int
    SelectedItems   []string
    ShowValuesAs    PivotTableShowValuesAs
}
Subtotal specifies the aggregation function that applies to this data field. The default value is Sum. The possible values for this attribute are:
| Optional Value |
|---|
| Average |
| Count |
| CountNums |
| Max |
| Min |
| Product |
| StdDev |
| StdDevp |
| Sum |
| Var |
| Varp |
Name specifies the name of the data field. Maximum 255 characters are allowed in data field name, excess characters will be truncated.
SelectedItems option is used to specify the default selected items in a pivot table field. The selected items must fall within the range of items selected in the pivot table.
SelectedItems specifies the default selected items in a pivot table field. The selected items must be values within the cell range referenced by that field.
ShowValuesAs specifies the calculation type for showing values in a pivot table values fields. The possible values for the Type field of ShowValuesAs are:
| Optional Value |
|---|
| PivotTableShowValuesAsPercentOfGrandTotal |
| PivotTableShowValuesAsPercentOfColumnTotal |
| PivotTableShowValuesAsPercentOfRowTotal |
| PivotTableShowValuesAsPercentOf |
| PivotTableShowValuesAsPercentOfParentRowTotal |
| PivotTableShowValuesAsPercentOfParentColumnTotal |
| PivotTableShowValuesAsPercentOfParentTotal |
| PivotTableShowValuesAsDifferenceFrom |
| PivotTableShowValuesAsPercentDifferenceFrom |
| PivotTableShowValuesAsRunningTotalIn |
| PivotTableShowValuesAsPercentRunningTotalIn |
| PivotTableShowValuesAsRankSmallestToLargest |
| PivotTableShowValuesAsRankLargestToSmallest |
| PivotTableShowValuesAsIndex |
Note that the base field and base item settings of ShowValuesAs are only required for some calculation types, the calculation types requires base field settings are:
| Calculation Types |
|---|
| PivotTableShowValuesAsPercentOf |
| PivotTableShowValuesAsPercentOfParentTotal |
| PivotTableShowValuesAsDifferenceFrom |
| PivotTableShowValuesAsPercentDifferenceFrom |
| PivotTableShowValuesAsRunningTotalIn |
| PivotTableShowValuesAsPercentRunningTotalIn |
| PivotTableShowValuesAsRankSmallestToLargest |
| PivotTableShowValuesAsRankLargestToSmallest |
The supported calculation types requires base item settings are:
| Calculation Types |
|---|
| PivotTableShowValuesAsPercentOf |
| PivotTableShowValuesAsDifferenceFrom |
| PivotTableShowValuesAsPercentDifferenceFrom |
Create pivot table
func (f *File) AddPivotTable(opts *PivotTableOptions) error
AddPivotTable provides the method to add pivot table by given pivot table options.
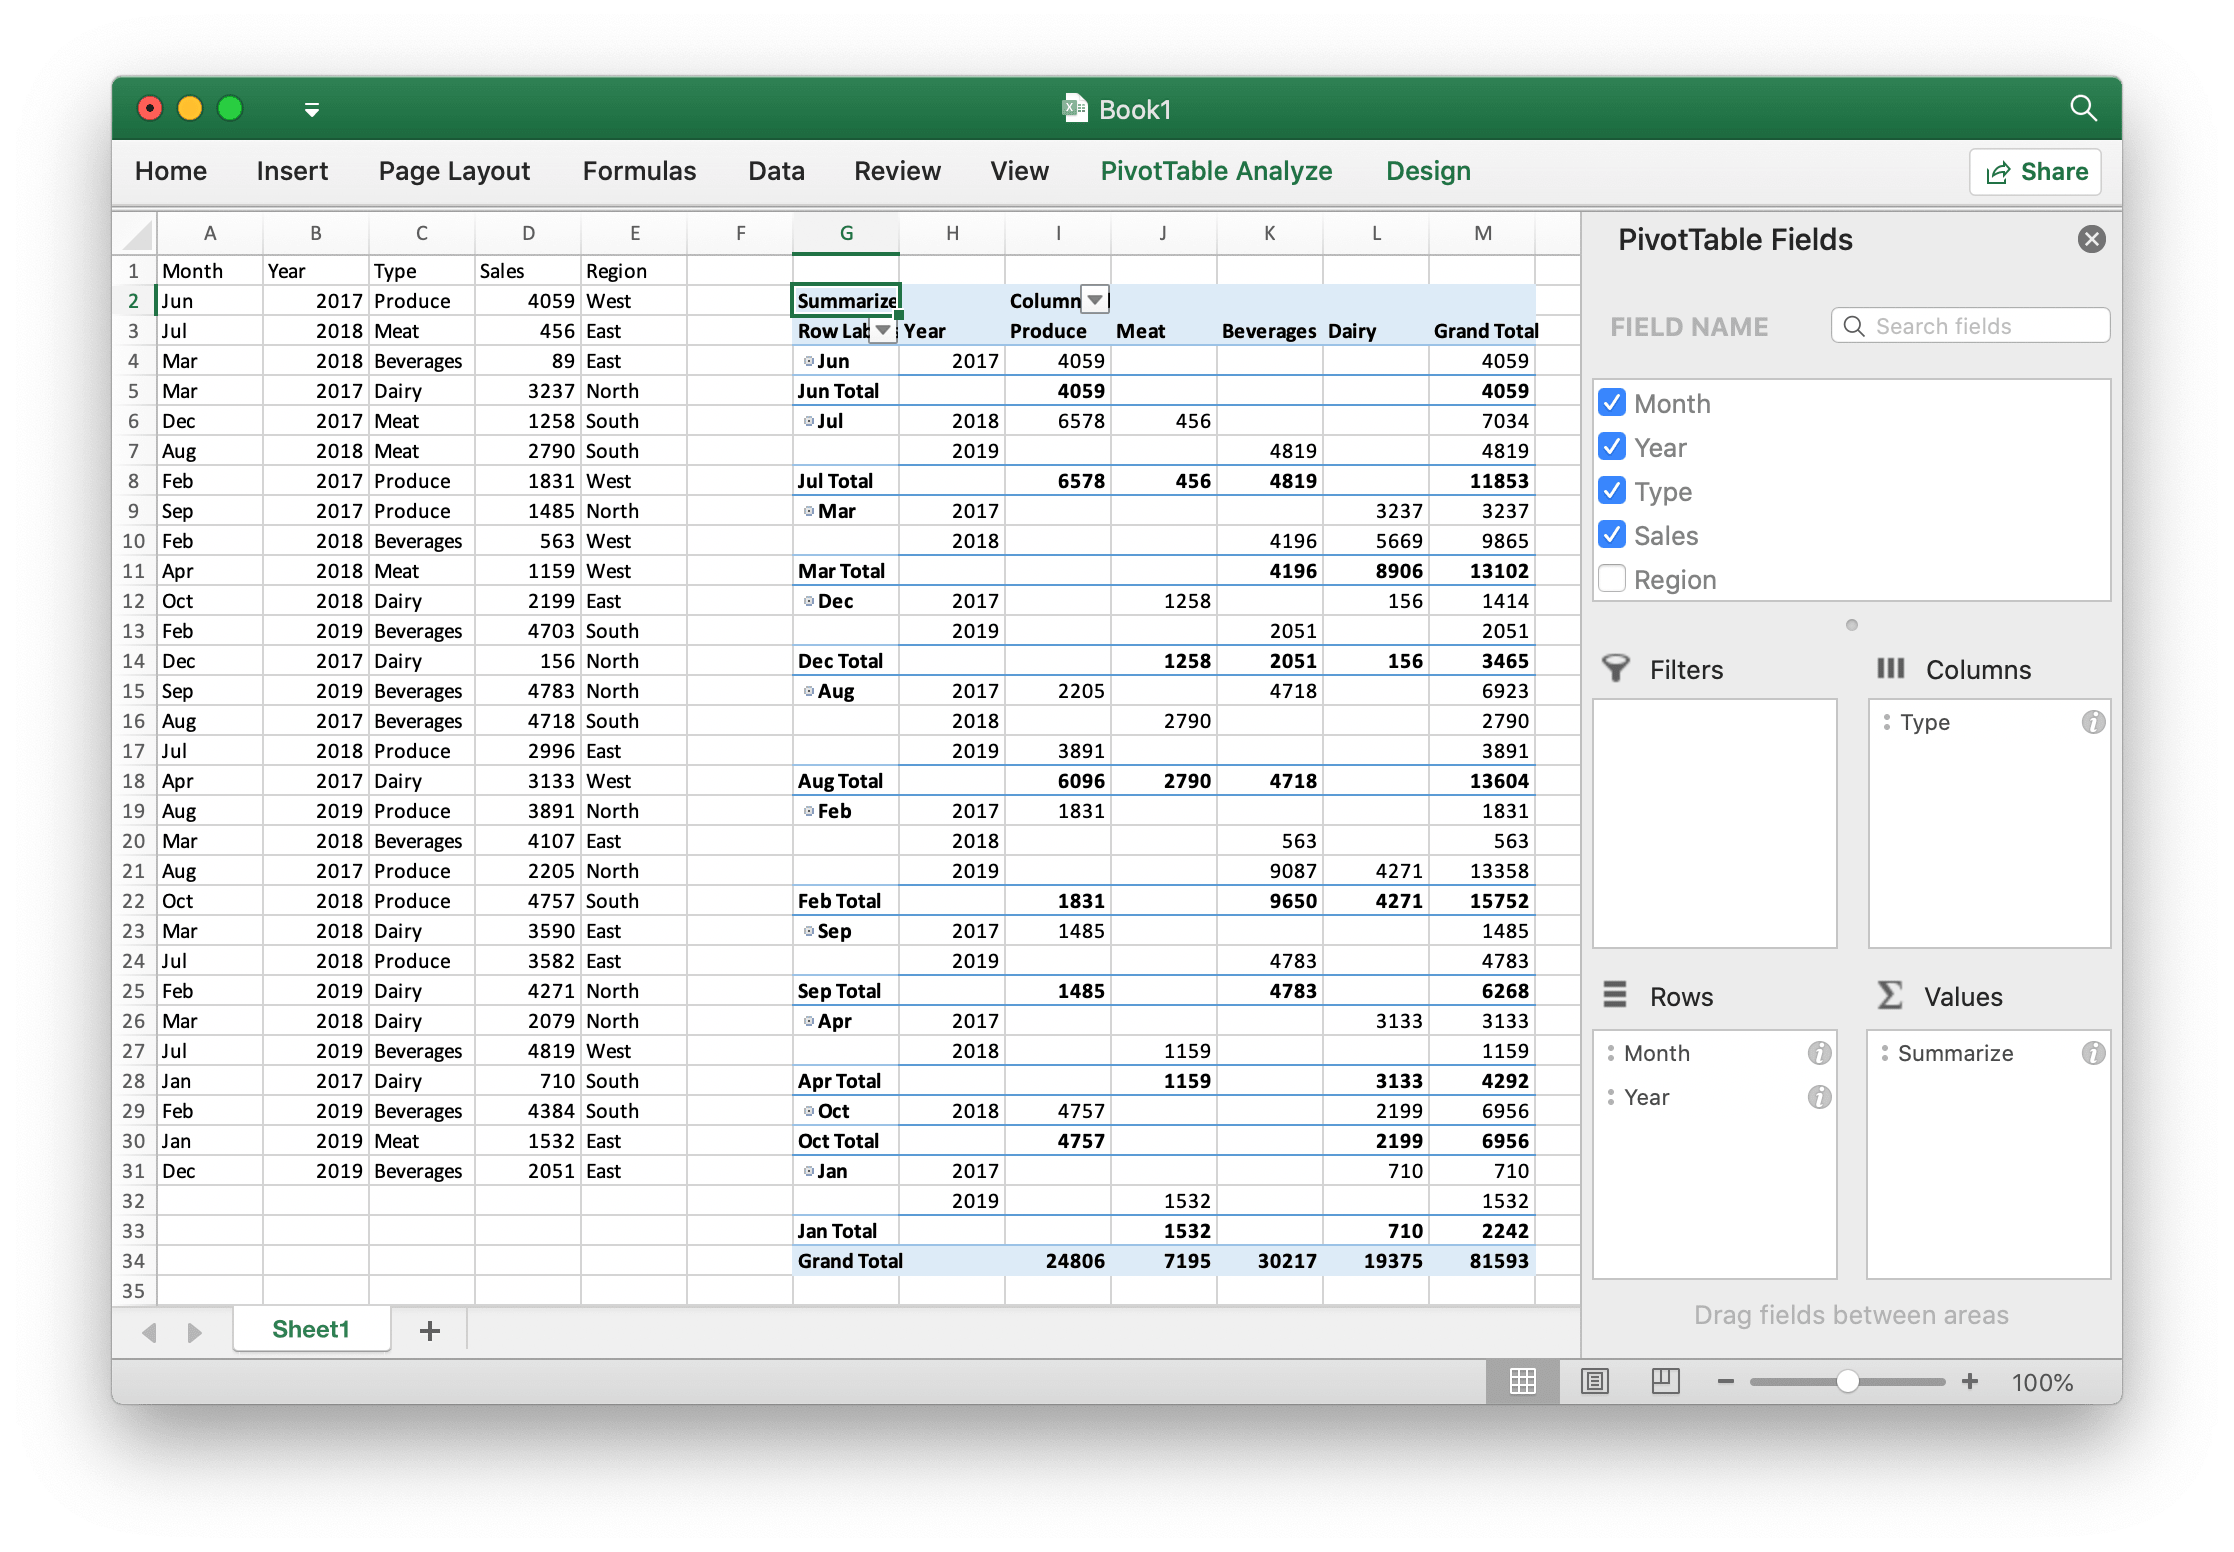
For example, create a pivot table on the Sheet1!G4:M30 area with the region Sheet1!A1:E31 as the data source, summarize by sum for sales:
package main

import (
    "fmt"

    "github.com/xuri/excelize/v2"
)

func main() {
    f := excelize.NewFile()
    defer func() {
        if err := f.Close(); err != nil {
            fmt.Println(err)
        }
    }()
    // Create some data in a sheet
    month := []string{"Jan", "Feb", "Mar", "Apr", "May",
        "Jun", "Jul", "Aug", "Sep", "Oct", "Nov", "Dec"}
    year := []int{2017, 2018, 2019}
    types := []string{"Meat", "Dairy", "Beverages", "Produce"}
    revenue := []int{3217, 4512, 3891, 4738, 3054, 4265, 3643, 4901, 3378, 4126}
    region := []string{"East", "West", "North", "South"}
    if err := f.SetSheetRow(
        "Sheet1", "A1", &[]string{"Month", "Year", "Type", "Revenue", "Region"},
    ); err != nil {
        fmt.Println(err)
        return
    }
    for row := 2; row < 32; row++ {
        f.SetCellValue("Sheet1", fmt.Sprintf("A%d", row), month[(row-2)%len(month)])
        f.SetCellValue("Sheet1", fmt.Sprintf("B%d", row), year[(row-2)%len(year)])
        f.SetCellValue("Sheet1", fmt.Sprintf("C%d", row), types[(row-2)%len(types)])
        f.SetCellValue("Sheet1", fmt.Sprintf("D%d", row), revenue[(row-2)%len(revenue)])
        f.SetCellValue("Sheet1", fmt.Sprintf("E%d", row), region[(row-2)%len(region)])
    }
    if err := f.AddPivotTable(&excelize.PivotTableOptions{
        DataRange:       "Sheet1!A1:E31",
        PivotTableRange: "Sheet1!G4:M30",
        Rows: []excelize.PivotTableField{
            {Data: "Month", DefaultSubtotal: true}, {Data: "Year"},
        },
        Filter: []excelize.PivotTableField{
            {Data: "Region"}},
        Columns: []excelize.PivotTableField{
            {Data: "Type", DefaultSubtotal: true},
        },
        Data: []excelize.PivotTableField{
            {Data: "Revenue", Name: "Summarize", Subtotal: "Sum"},
        },
        RowGrandTotals: true,
        ColGrandTotals: true,
        ShowDrill:      true,
        ShowRowHeaders: true,
        ShowColHeaders: true,
        ShowLastColumn: true,
    }); err != nil {
        fmt.Println(err)
        return
    }
    if err := f.SaveAs("Book1.xlsx"); err != nil {
        fmt.Println(err)
    }
}
Get pivot tables
func (f *File) GetPivotTables(sheet string) ([]PivotTableOptions, error)
GetPivotTables returns all pivot table definitions in a worksheet by given worksheet name.
Delete pivot table
func (f *File) DeletePivotTable(sheet, name string) error
DeletePivotTable delete a pivot table by giving the worksheet name and pivot table name. Note that this function does not clean cell values in the pivot table range.